. 2017 Jan 13:10:310.
doi: 10.3389/fncel.2016.00310. eCollection 2016.

Differences in the Cellular Response to Acute Spinal Cord Injury between Developing and Mature Rats Highlights the Potential Significance of the Inflammatory Response

Affiliations

Differences in the Cellular Response to Acute Spinal Cord Injury between Developing and Mature Rats Highlights the Potential Significance of the Inflammatory Response

Theresa C Sutherland et al. Front Cell Neurosci. .

Abstract

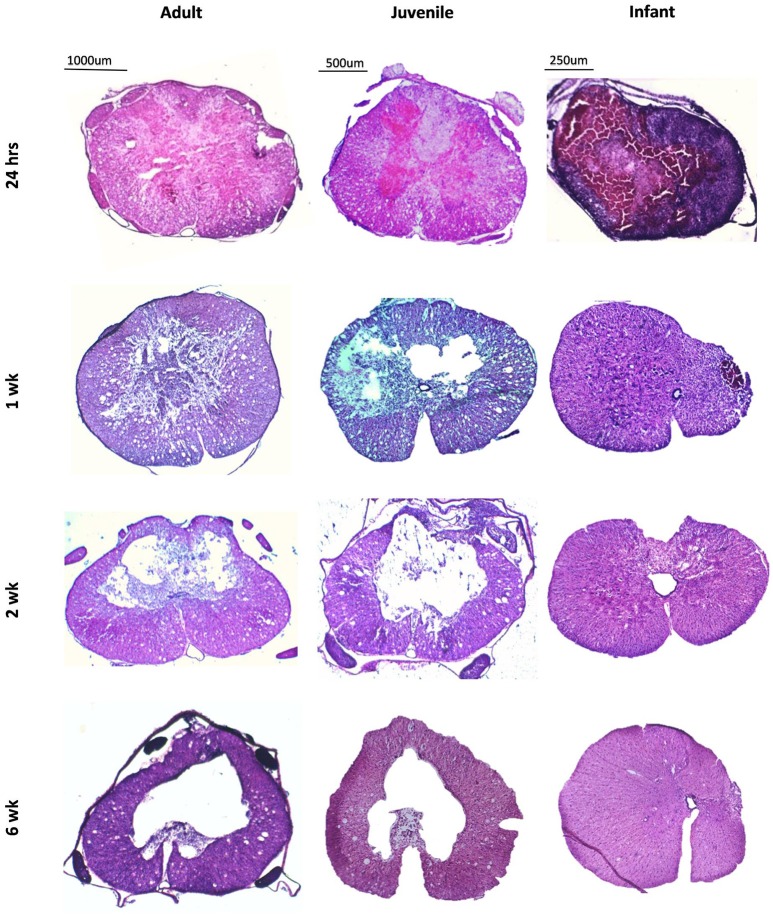
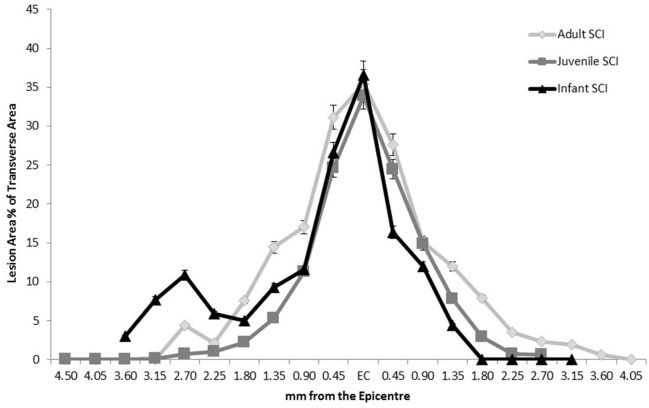
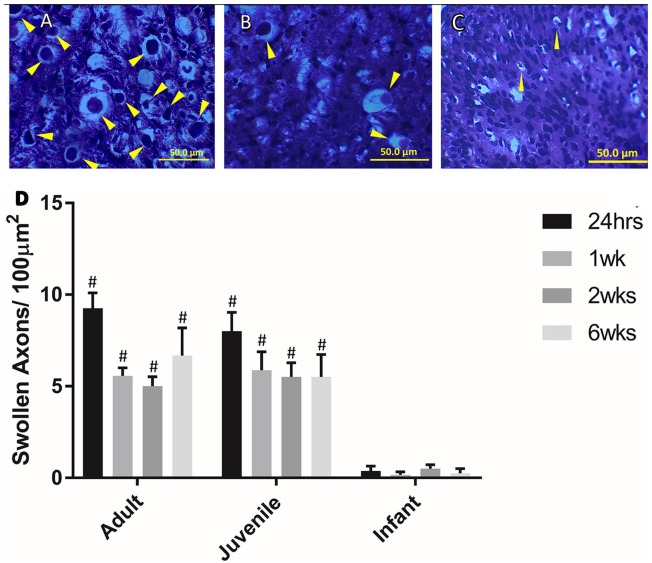
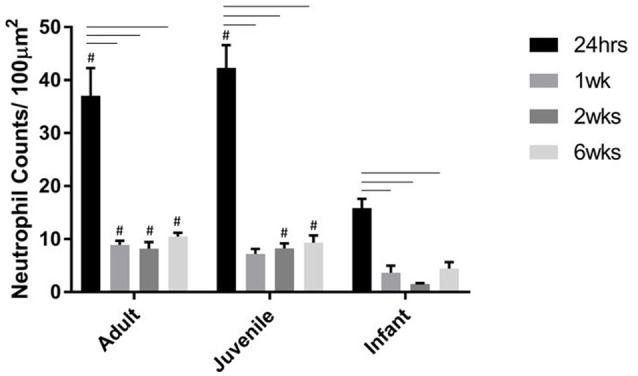
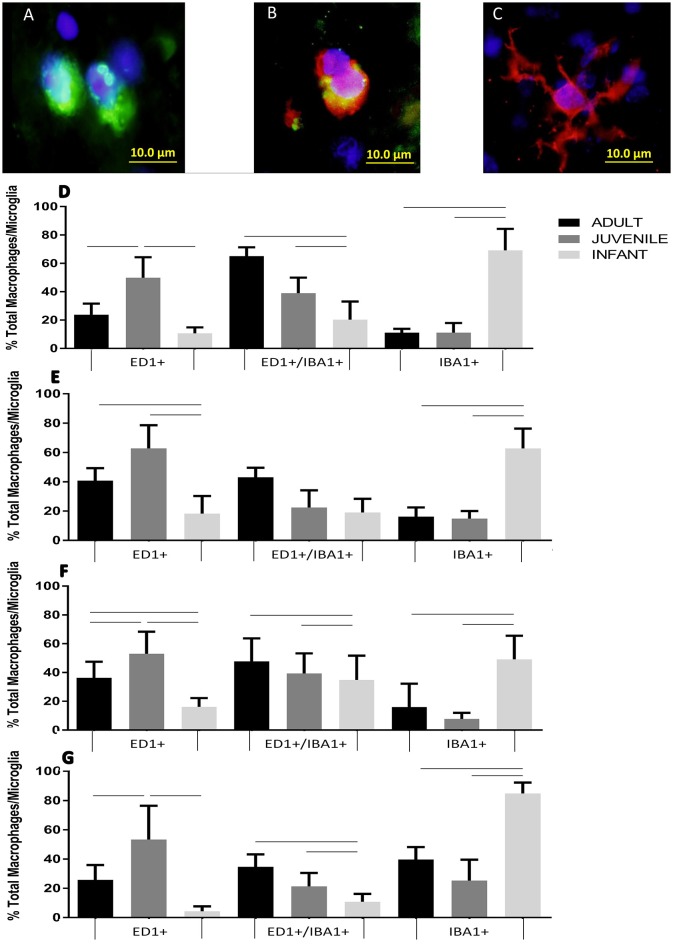
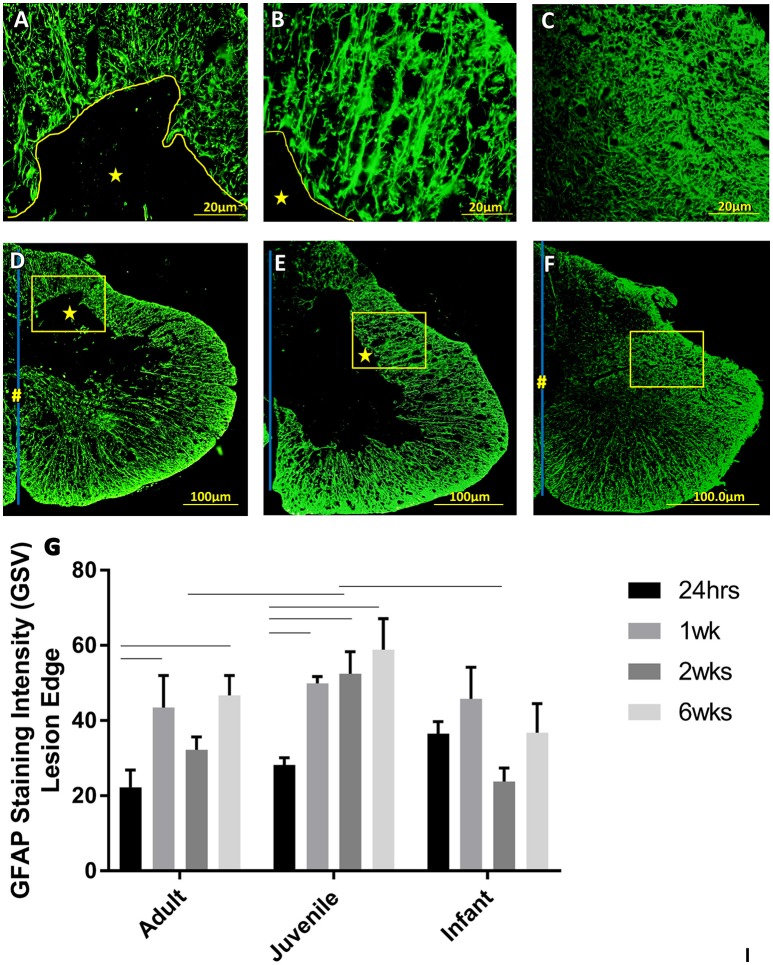
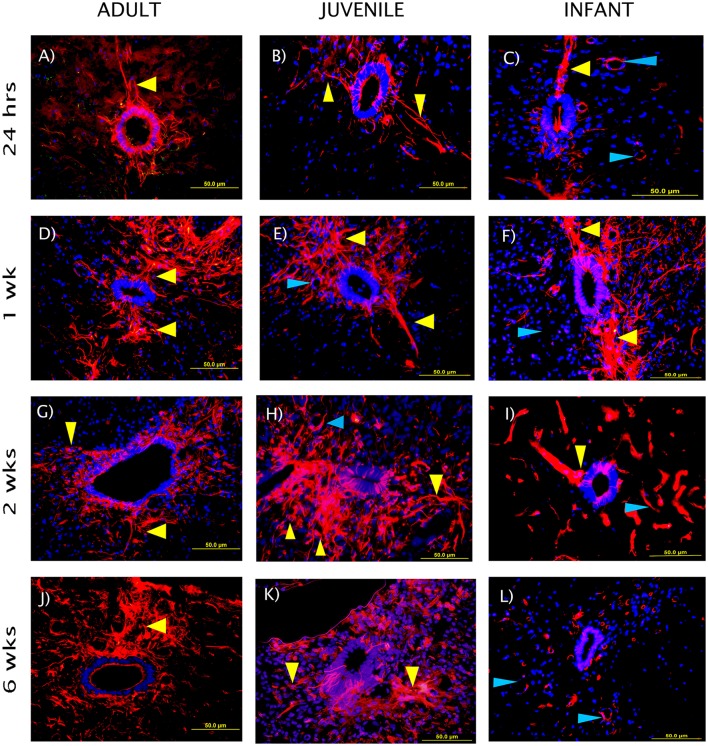
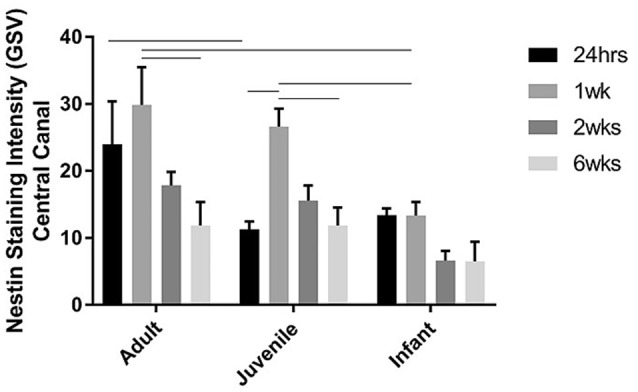
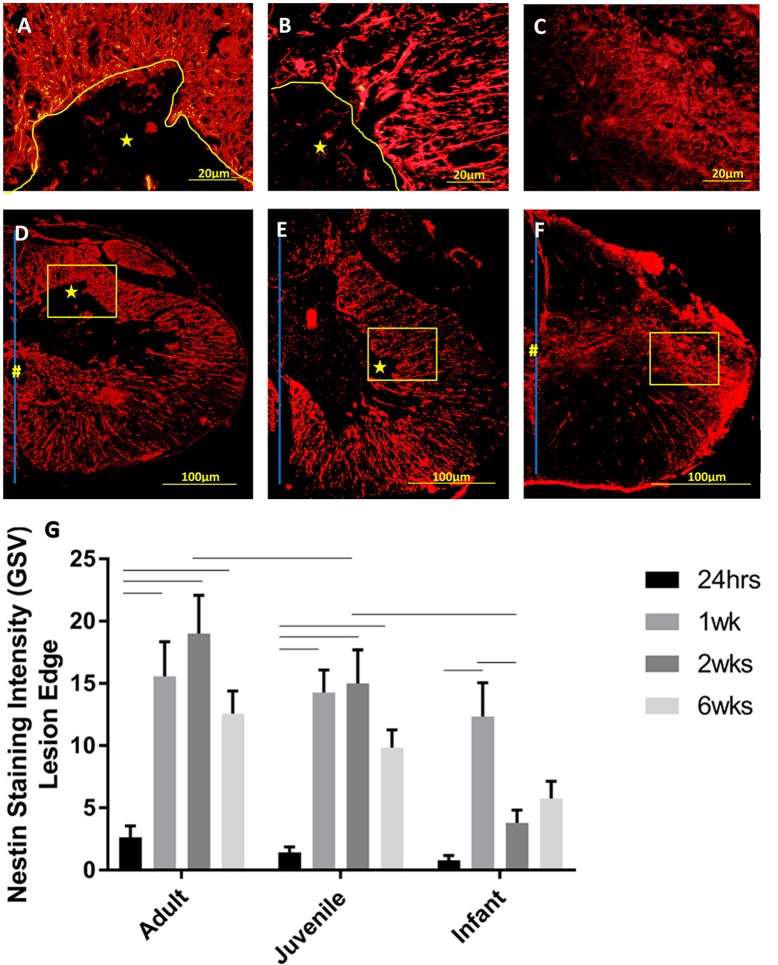
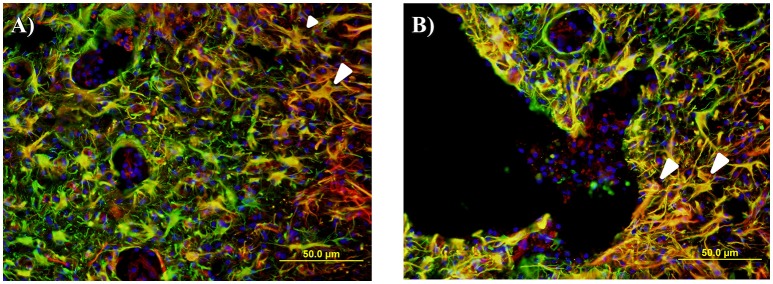
There exists a trend for a better functional recovery from spinal cord injury (SCI) in younger patients compared to adults, which is also reported for animal studies; however, the reasons for this are yet to be elucidated. The post injury tissue microenvironment is a complex milieu of cells and signals that interact on multiple levels. Inflammation has been shown to play a significant role in this post injury microenvironment. Endogenous neural progenitor cells (NPC), in the ependymal layer of the central canal, have also been shown to respond and migrate to the lesion site. This study used a mild contusion injury model to compare adult (9 week), juvenile (5 week) and infant (P7) Sprague-Dawley rats at 24 h, 1, 2, and 6 weeks post-injury (n = 108). The innate cells of the inflammatory response were examined using counts of ED1/IBA1 labeled cells. This found a decreased inflammatory response in the infants, compared to the adult and juvenile animals, demonstrated by a decreased neutrophil infiltration and macrophage and microglial activation at all 4 time points. Two other prominent cellular contributors to the post-injury microenvironment, the reactive astrocytes, which eventually form the glial scar, and the NPC were quantitated using GFAP and Nestin immunohistochemistry. After SCI in all 3 ages there was an obvious increase in Nestin staining in the ependymal layer, with long basal processes extending into the parenchyma. This was consistent between age groups early post injury then deviated at 2 weeks. The GFAP results also showed stark differences between the mature and infant animals. These results point to significant differences in the inflammatory response between infants and adults that may contribute to the better recovery indicated by other researchers, as well as differences in the overall injury progression and cellular responses. This may have important consequences if we are able to mirror and manipulate this response in patients of all ages; however much greater exploration in this area is required.

Keywords: age-related; endogenous neural progenitor cells; inflammation; innate immune cells; microglia; neonates; spinal cord injury.


Figures

Figure 1
Figure 1
Low power images of coronal sections of rat spinal cord following a T10 contusion injury stained with Haematoxylin and Eosin. Images are taken from the lesion center in adult, juvenile and infant spinal cords at four time points post injury; 24 h, 1, 2, and 6 weeks. All lesions show hemorrhage and tissue disruption at 24 h post injury. The adult and juvenile rats show increasing cavitation from 1 week, whereas the infant cords exhibit marked asymmetry after 1 week.
Figure 2
Figure 2
Comparison of the extent of the lesion along the spinal cord length in all three age groups at 24 h post-injury, showing a similar pattern of injury therefore confirming a comparable injury. Sham and control groups are not shown as they were 0 with no variance.
Figure 3
Figure 3
Examples of swollen axons in (A) Adult, (B) Juvenile, and (C) Infant white matter 1 week post injury. (D) Histogram of the number of swollen axons per 100 μm in the lateral and ventral white matter at the lesion center by age group, at 24 h, 1, 2, and 6 weeks post injury. # indicates a statistically significant increase (P < 0.001) in swollen axons in the adult and juvenile groups compared to the infants. Controls are not shown as they did not show any swollen axons. Yellow arrows indicate typical swollen axons.
Figure 4
Figure 4
Histogram of the number of neutrophils per 100 μm2 at the lesion center of the spinal cord at 24 h, 1, 2, and 6 weeks post injury. Using two-way ANOVA there was significant difference (P < 0.0001) found in both main effects, age and survival time, as well as the interaction (P < 0.0006). There was a significant difference (P < 0.001) between the 24 h time-point and the later time-points. # (P < 0.005) indicates a significant difference between the infants and the adult and juvenile groups based on Bonferroni's post-hoc test.
Figure 5
Figure 5
Example fluorescent images of (A) ED1 positive phagocytes, (B) EDI/IBA1 duel positive phagocytes, and (C) IBA1 positive ramified microglia. Histograms of the proportion of the total macrophage/microglial population at the lesion center of the spinal cord stained with ED1+/IBA1 (ED1+), ED1+/IBA1+ and ED1/IBA1+ (IBA1+) at (D) 24 h, (E) 1 week, (F), 2 weeks and (G) 6 weeks post-injury. Significant differences (P < 0.05) between groups are shown based on Bonferroni's post-hoc test.
Figure 6
Figure 6
Representative high power fluorescent images of astrocytic processes at the lesion edge in (A) Adults, (B) Juveniles, and (C) Infants. These represent the areas denoted by the squares in low power images of one side of the transverse spinal cord shown in (D) Adults, (E) Juveniles, and (F) Infants 1 week post injury. This demonstrates astrogliosis around the lesion and astrocytes in the spared white and gray matter stained with GFAP (green). The lesion is denoted by *, the central canal is indicated by # where it is intact and the midline by the blue line. (G) Histograms of the intensity of glial fibrillary acidic protein (GFAP) staining (mean grayscale value) at the edge of the lesion at 24 h, 1, 2, and 6 weeks post-injury. Using two-way ANOVA there was significant difference found in both main effects, age (P < 0.005) and survival time (P < 0.0002) as well as the interaction (P < 0.05). Significant differences (P < 0.05) between groups are shown based on Bonferroni's post-hoc test.
Figure 7
Figure 7
Representative fluorescent microscopy images of the central canal taken at 400×, 2.25 mm distal to the lesion center, stained with nestin as a marker for endogenous neural progenitor cells (red). The nuclei are shown in blue. The ependymal layer of the central canal and long processes extending into the parenchyma can be seen (yellow arrows), some blood vessels are also visible as strongly nestin positive (blue arrows). The staining intensity in the infants is visibly lower than the adults and juveniles at the 2 and 6 week time points. (A–C) show the initial reaction at 24 h post-injury, (D–F) at 1 week, (G–I) at 2 weeks, and (J–L) depict the fading reaction at 6 weeks post-injury.
Figure 8
Figure 8
Histogram of the intensity of nestin staining (mean grayscale value) indicating endogenous neural progenitor cells around the ependymal layer of the central canal across the lesion, at 24 h, 1, 2, and 6 weeks post-injury. Using two-way ANOVA there was a significant difference (P < 0.005) in both main effects, age and survival time. Significant differences (P < 0.005) are shown between groups based on Bonferroni's post-hoc test.
Figure 9
Figure 9
Representative high power fluorescent images of nestin staining (red) at the lesion edge in (A) Adults, (B) Juveniles, and (C) Infants. These represent the areas denoted by the squares in low power images of one side of the transverse spinal cord shown in (D) Adults, (E) Juveniles, and (F) Infants 1 week post injury. The lesion is denoted by *, the central canal is indicated by # where it is intact, and the midline by the blue line. (G) Histogram of the intensity of nestin staining (mean grayscale value) indicating endogenous neural progenitor cells and processes around the edge of the lesion or cavity at 24 h, 1, 2, and 6 weeks post-injury. Using two-way ANOVA there was a significant difference (P < 0.0001) in both main effects, age and survival time. Significant differences (P < 0.005) are shown between groups based on Bonferroni's post-hoc test.
Figure 10
Figure 10
Representative fluorescent microscopy images of gray matter (A) and lesion edge (B) taken at 400×, 2.25 mm distal to the center of the injury, stained with nestin as a marker for endogenous neural progenitor cells (red) and glial fibrillary acidic protein (GFAP) for astrocytes (green). This shows a number of double labeled cells and processes in an orange color, many of which have an astrocytic appearance (white arrows).

References

    1. Ajami B., Bennett J. L., Krieger C., McNagny K. M., Rossi F. M. (2011). Infiltrating monocytes trigger EAE progression, but do not contribute to the resident microglia pool. Nat. Neurosci. 14, 1142–1149. 10.1038/nn.2887 - DOI - PubMed
    1. Apple D. F., Anson C. A., Hunter J. D., Bell R. B. (1995). Spinal cord injury in youth. Clin. Pediatr. 34, 90–95. 10.1177/000992289503400205 - DOI - PubMed
    1. Baldwin S. A., Broderick R., Blades D. A., Scheff S. W. (1998). Alterations in temporal/spatial distribution of GFAP-and vimentin-positive astrocytes after spinal cord contusion with the New York University spinal cord injury device. J. Neurotrauma 15, 1015–1026. 10.1089/neu.1998.15.1015 - DOI - PubMed
    1. Barnabé-Heider F., Frisén J. (2008). Stem cells for spinal cord repair. Cell Stem Cell 3, 16–24. 10.1016/j.stem.2008.06.011 - DOI - PubMed
    1. Barnabé-Heider F., Göritz C., Sabelström H., Takebayashi H., Pfrieger F. W., Meletis K., et al. . (2010). Origin of new glial cells in intact and injured adult spinal cord. Cell Stem Cell 7, 470–482. 10.1016/j.stem.2010.07.014 - DOI - PubMed

LinkOut - more resources