. 2017 Jan 30:8:14290.
doi: 10.1038/ncomms14290.

THZ1 targeting CDK7 suppresses STAT transcriptional activity and sensitizes T-cell lymphomas to BCL2 inhibitors

Affiliations

THZ1 targeting CDK7 suppresses STAT transcriptional activity and sensitizes T-cell lymphomas to BCL2 inhibitors

Florencia Cayrol et al. Nat Commun. .

Erratum in

Abstract

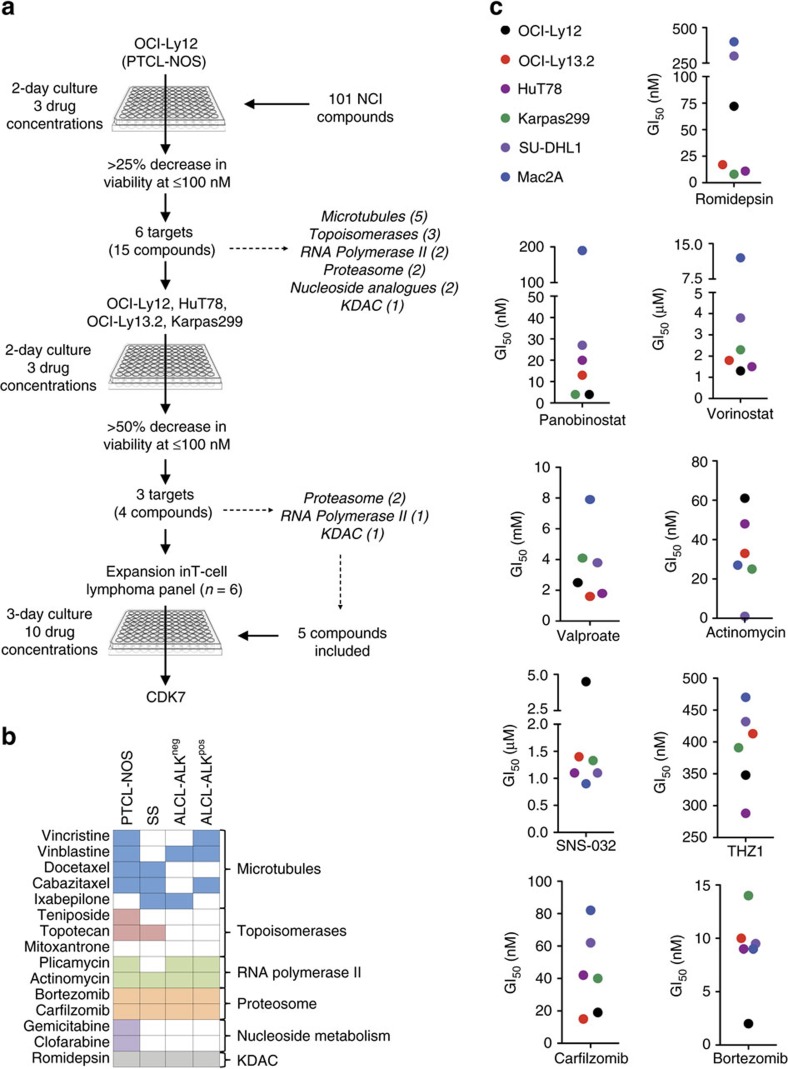
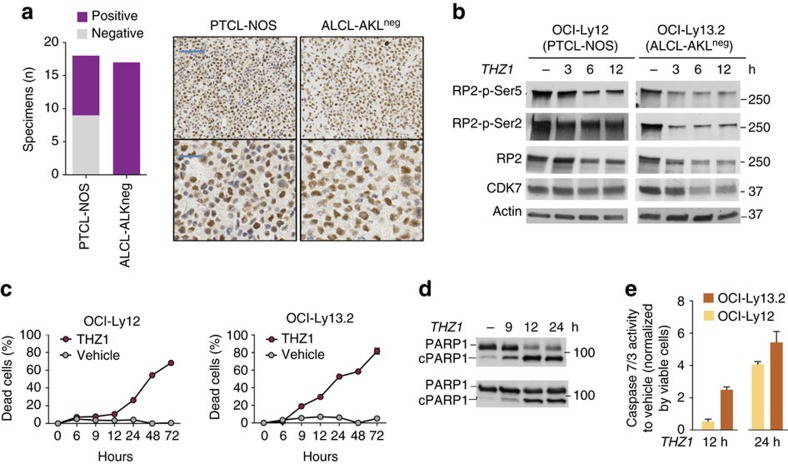
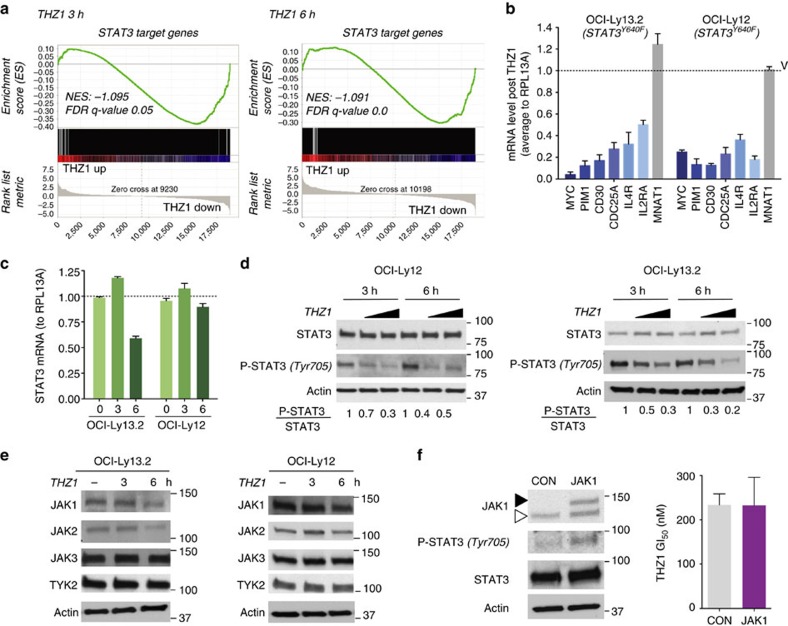
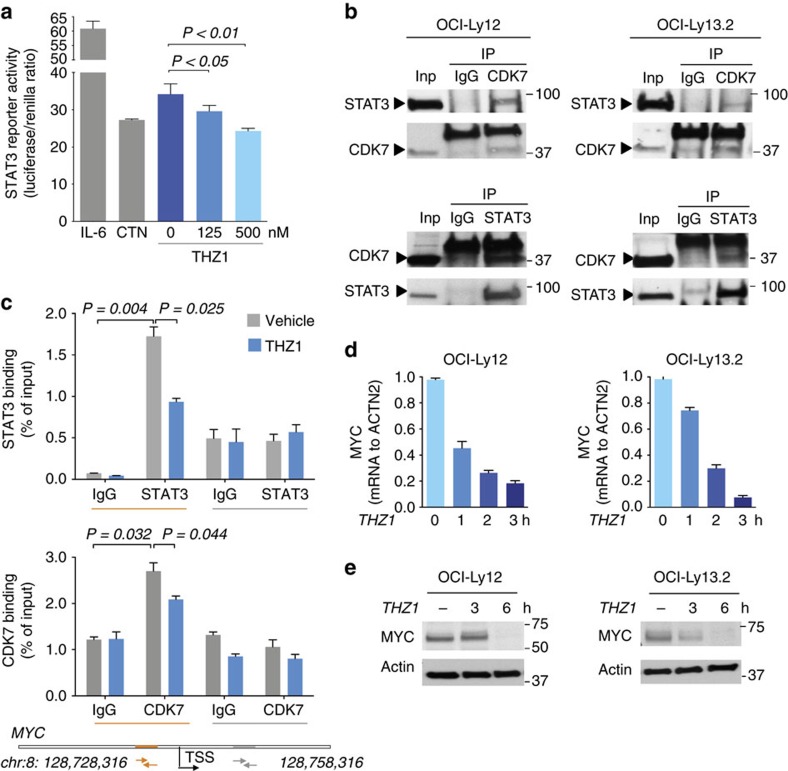
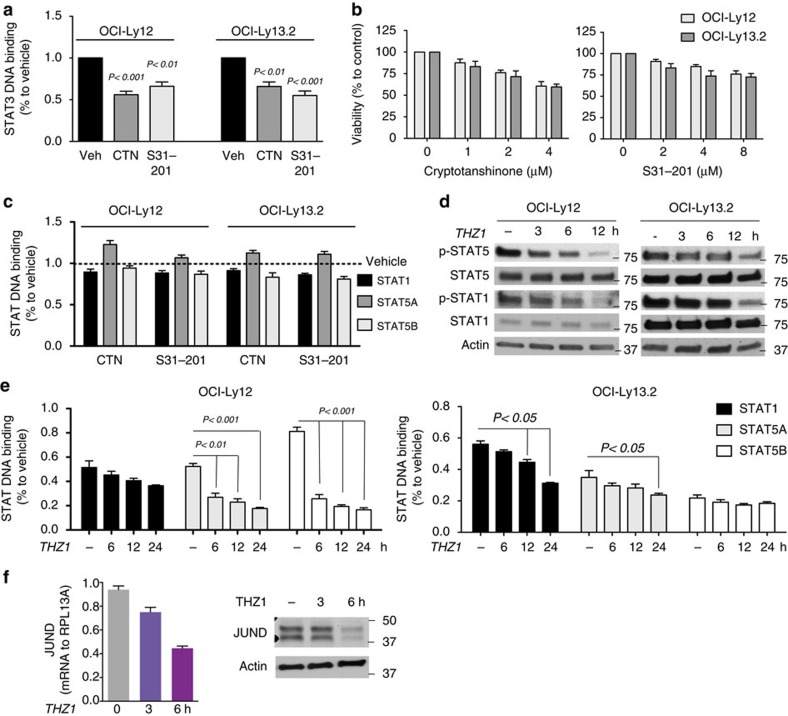
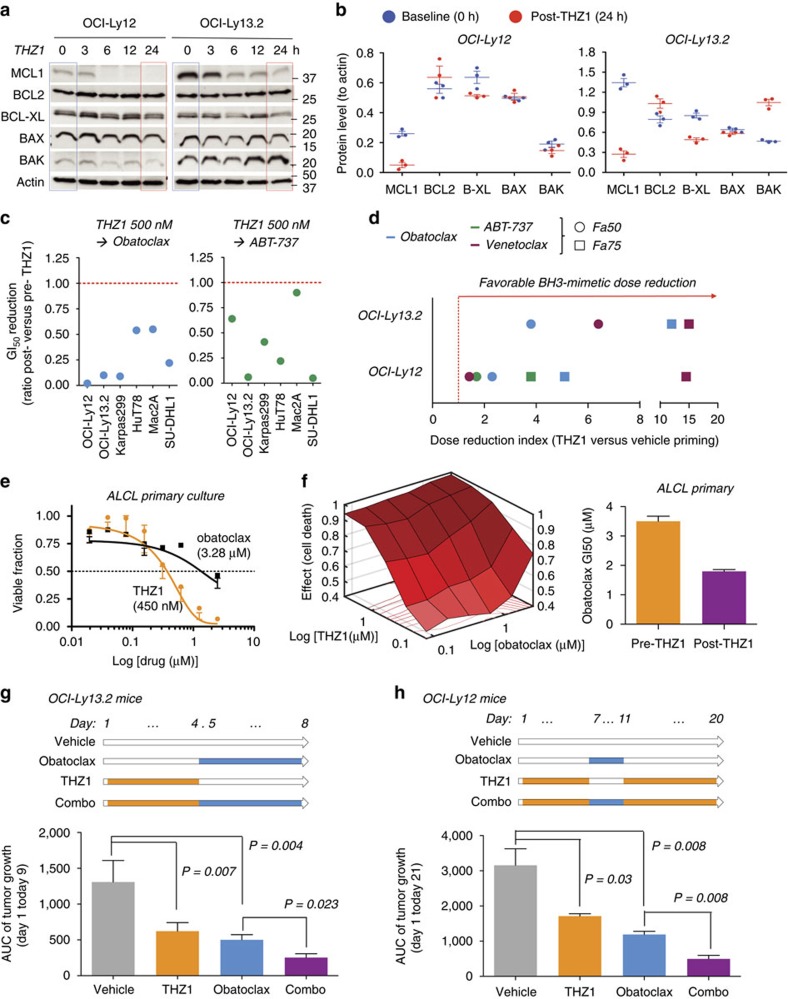
Peripheral T-cell lymphomas (PTCL) are aggressive diseases with poor response to chemotherapy and dismal survival. Identification of effective strategies to target PTCL biology represents an urgent need. Here we report that PTCL are sensitive to transcription-targeting drugs, and, in particular, to THZ1, a covalent inhibitor of cyclin-dependent kinase 7 (CDK7). The STAT-signalling pathway is highly vulnerable to THZ1 even in PTCL cells that carry the activating STAT3 mutation Y640F. In mutant cells, CDK7 inhibition decreases STAT3 chromatin binding and expression of highly transcribed target genes like MYC, PIM1, MCL1, CD30, IL2RA, CDC25A and IL4R. In surviving cells, THZ1 decreases the expression of STAT-regulated anti-apoptotic BH3 family members MCL1 and BCL-XL sensitizing PTCL cells to BH3 mimetic drugs. Accordingly, the combination of THZ1 and the BH3 mimetic obatoclax improves lymphoma growth control in a primary PTCL ex vivo culture and in two STAT3-mutant PTCL xenografts, delineating a potential targeted agent-based therapeutic option for these patients.


Conflict of interest statement

The authors declare no competing financial interests.

Figures

Figure 1
Figure 1. Screen for antineoplastic drugs and therapeutic targets in PTCL cell lines.
(a) Screen setup and results. (b) Extended target validation in four PTCL cell lines (top). Drugs that showed >50% decrease in viability at <100 nM are shown as filled squares. (c) Growth inhibitory concentration 50% (GI50, Y axis) for nine compounds (shown on bottom) in an extended panel of six PTCL cell lines.
Figure 2
Figure 2. CDK7 is a survival factor in PTCL.
(a) CDK7 protein expression by immunohistochemistry in PTCL-NOS (n=18) and ALCL-ALKneg (n=17) cases. Representative microphotographs (upper pictures taken at 10 × , scale bar represents 100 μm and lower pictures at 40 × , scale bar represents 50 μm) are shown on the right. (b) Immunoblots of CTD phospho-Ser5 and phospho-Ser2 of RNA polymerase II (RP2) and total RNA polymerase II and CDK7 in PTCL cells treated with THZ1 for the indicated time points. (c) Proportion of dead cells in OCI-Ly12 and OCI-Ly13.2 cells treated with THZ1 500 nM for up to 72 h. (d) PARP1 and cleaved PARP1 in OCI-Ly12 and OCI-Ly13.2 cells treated with THZ1 500 nM for up to 24 h. (e) Caspases 7 and 3 activity in OCI-Ly12 and OCI-Ly13.2 cells treated with 500 nM of THZ1 for 12 and 24 h. Data is presented as fold-change in activity relative to vehicle as means with 95% CI for quintuplicates.
Figure 3
Figure 3. THZ1 inhibits STAT3Y640F signalling.
(a) Gene set enrichment analysis of STAT3 target genes using ranked gene expression changes after 500 nM THZ1 treatment for 3 h (left) and 6 h (right) in OCI-Ly13.2 cells. NES and FDR are indicated based on 5,000 permutations. (b) Transcript levels (to RPL13A) of the selected STAT3 target genes MYC, PIM1, CD30, CDC25A, IL4R and IL2RA and the negative control MNAT1 after treatment of OCI-Ly13.2 and OCI-Ly12 cells with 500 nM THZ1 for 6 h. Data are presented as mean with 95% CI for triplicates. (c) Time-dependent effect of THZ1 500 nM in STAT3 transcript level in OCI-Ly12 and OCI-Ly13.2 cells. Data are presented as mean with 95% CI for triplicates. (d) Time and dose-dependent protein levels of STAT3 and phospho-STAT3 Tyr705 in OCI-Ly12 and OCI-Ly13.2 cells treated with THZ1 250 and 500 nM. Densitometry analysis is shown at the bottom. (e) Time-dependent effect of THZ1 500 nM in protein levels of the Tyr705 STAT3 kinases JAK1, JAK2, JAK3 and TYK2. (f) Effect on the GI50 of THZ1 in Jurkat cells transfected with an active JAK1 plasmid. Endogenous JAK1 is shown with white arrowhead and exogenous JAK1 is marked with black arrowhead. Data are presented as mean with 95% CI for triplicates.
Figure 4
Figure 4. THZ1 unbinds mutant STAT3 from the MYC gene.
(a) STAT3 reporter activity upon administration of IL-6 10 ng ml−1, the STAT3 inhibitor cryptotanshinone (CTN) 2.5 μM and THZ1 (vehicle, 125 and 500 nM). Data are presented as median with median absolute deviation for quintuplicates. P-values obtained from a Mann–Whitney test. (b) Reciprocal CDK7 and STAT3 co-immunoprecipitations in OCI-Ly12 and OCI-Ly13.2 cells. (c) CDK7 and STAT3 q-ChIP (IgG was used as control) on MYC gene in OCI-Ly13.2 cells baseline (vehicle, gray columns) and after 2 h of THZ1 500 nM (blue columns). Data presented as mean with standard error of the mean (SEM) for two independent replicates of triplicates. P-values obtained from a T-test. (d) MYC transcript levels in OCI-Ly12 and OCI-Ly13.2 cell lines upon THZ1 500 nM treatment for the indicated time points. Data are presented as mean with 95% CI for triplicates. P-values obtained from a T-test. (e) Myc protein levels in cells treated as in d.
Figure 5
Figure 5. THZ1 inhibits STAT1 and STAT5 signalling.
(a) Effect on STAT3 DNA binding activity of the STAT3 inhibitors cryptotanshinone (CTN) and S31-201 in STAT3 mutant cell lines OCI-Ly12 and OCI-Ly13.2. (b) Effect on cell viability at 48 h of the STAT3 inhibitors cryptotanshinone and S31-201 in OCI-Ly12 and OCI-Ly13.2 cells. (c) Activity of STAT1, STAT5a and STAT5b measured by DNA biding to a consensus sequence in nuclear extracts of OCI-Ly12 and OCI-Ly13.2 cells treated with cryptotanshinone (CTN) and S31-201. (d) Immunoblots of STAT5, STAT1, phospho-STAT5 and phospho-STAT1 (to actin) in PTCL cells treated with THZ1 500 nM for the indicated time points. (e) Activity of STAT1, STAT5a and STAT5b measured by DNA biding to a consensus sequence in nuclear extracts of OCI-Ly12 and OCI-Ly13.2 cells treated with 500 nM of THZ1 for the indicated time points. (f) JUND transcript (left) and protein (right) levels in OCI-Ly13.2 cells upon THZ1 500 nM treatment for the indicated time points. All data are presented as mean with 95% CI for triplicates. P-values obtained from T-test.
Figure 6
Figure 6. THZ1 sensitizes PTCL cells to BH3 mimetic drugs.
(a) Time-dependent effect of THZ1 500 nM in protein levels of anti-apoptotic BH3 proteins MCL1, BCL2 and BCL-XL and BH3 effectors BAX and BAK. The blue square indicates baseline levels and red square indicate baseline levels in surviving cells at 24 h. (b) Protein levels as ratio of BH3 proteins to actin before (in blue) and after (in red) treatment with THZ1 for 24 h in triplicate experiments. Data are presented as mean with 95% CI. (c) Effect of THZ1 500 nM treatment for 24 h on the GI50 of obatoclax and ABT-737 expressed as ratio between post and pre-THZ1 in PTCL cell lines. Red dotted line at 1.00 indicates unchanged ratio and points below the line indicates a reduced GI50 after THZ1 at 48 h. (d) Dose-reduction index for BH3-mimetic drugs obatoclax, ABT-737 and venetoclax in the STAT3 mutant cell lines OCI-Ly12 and OCI-Ly13.2 after THZ1 priming for 24 h. The effects for fraction of cell killing 50% (Fa50) and 75% (Fa75%) are shown as circles or squares symbols, respectively. (e) Effect of THZ1 and obatoclax on the viability of an ALCL primary culture. The GI50 for each drug is shown between parentheses. (f) Response-surface analysis for the combination of eight concentrations of THZ1 and obatoclax on the viability of the primary ALCL culture. Darker shades of red indicate higher killing effect. Effect of THZ1 (at 1:5 ratio) on the GI50 of obatoclax. Data are presented as mean with 95% CI for triplicates. (g) Schedule of administration for in vivo treatment of OCI-Ly13.2 mice (top). Area under the curve (AUC) of tumour growth from day 1 to day 9 in OCI-Ly13.2 xenografted mice treated as shown in the schedule. (h) Schedule of administration for in vivo treatment of OCI-Ly12 mice (top). AUC of tumour growth from day 1 to day 21 in OCI-Ly12 xenografted mice treated as shown in the schedule. Data are presented as mean with 95% CI. P-values obtained from T-test.

References

    1. Iragavarapu C. et al.. Novel ALK inhibitors in clinical use and development. J. Hematol. Oncol. 8, 17 (2015). - PMC - PubMed
    1. Moskowitz A. J., Lunning M. A. & Horwitz S. M. How I treat the peripheral T-cell lymphomas. Blood 123, 2636–2644 (2014). - PMC - PubMed
    1. Vose J., Armitage J. & Weisenburger D. International, T. C. L. P. International peripheral T-cell and natural killer/T-cell lymphoma study: pathology findings and clinical outcomes. J. Clin. Oncol. 26, 4124–4130 (2008). - PubMed
    1. Pileri S. A. & Piccaluga P. P. New molecular insights into peripheral T cell lymphomas. J. Clin. Invest. 122, 3448–3455 (2012). - PMC - PubMed
    1. Iqbal J. et al.. Gene expression signatures delineate biological and prognostic subgroups in peripheral T-cell lymphoma. Blood 123, 2915–2923 (2014). - PMC - PubMed

Publication types

MeSH terms

LinkOut - more resources