. 2017 Jan 30:8:14219.
doi: 10.1038/ncomms14219.

Transcriptomic and anatomic parcellation of 5-HT3AR expressing cortical interneuron subtypes revealed by single-cell RNA sequencing

Affiliations

Transcriptomic and anatomic parcellation of 5-HT3AR expressing cortical interneuron subtypes revealed by single-cell RNA sequencing

Sarah Frazer et al. Nat Commun. .

Abstract

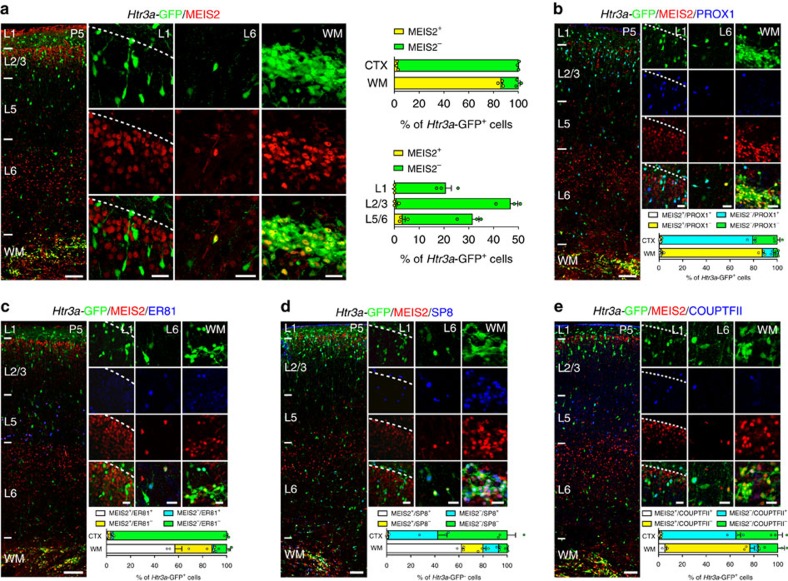
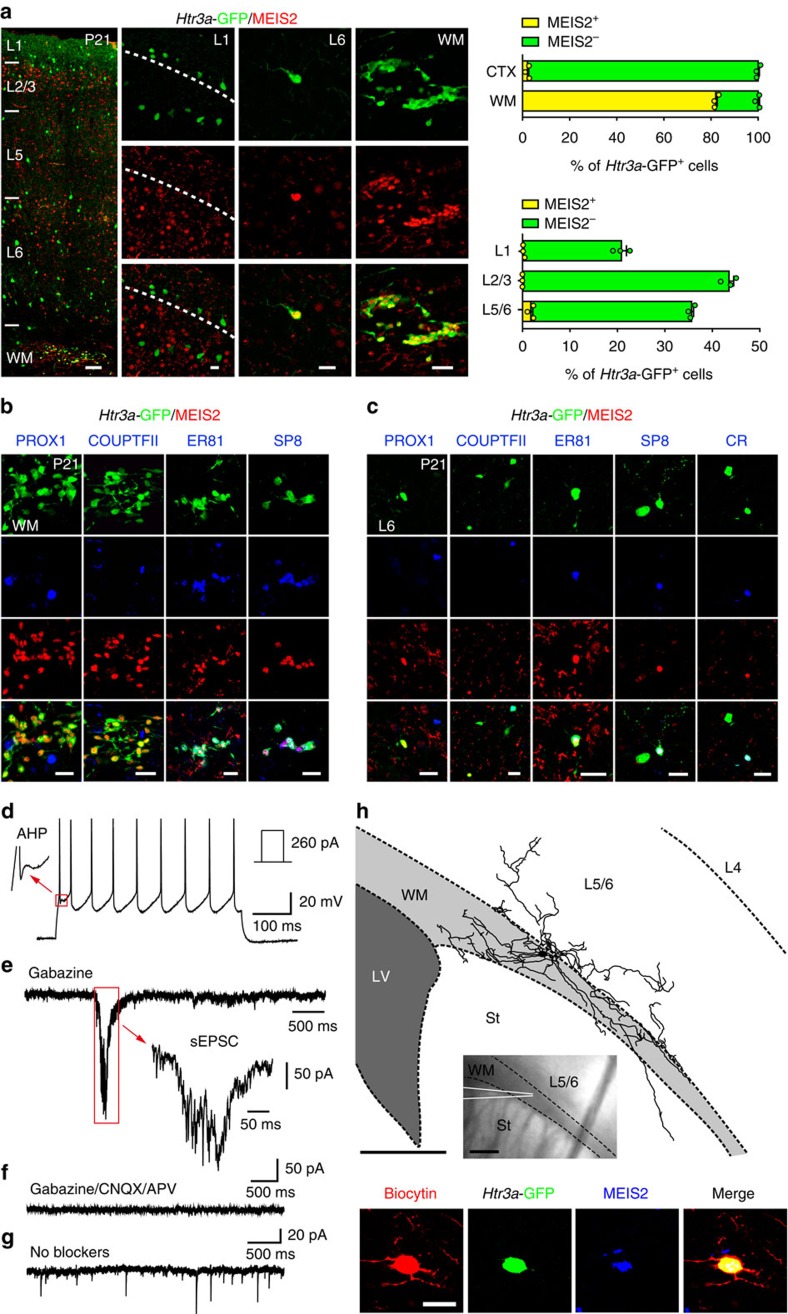
Cortical GABAergic interneurons constitute a highly diverse population of inhibitory neurons that are key regulators of cortical microcircuit function. An important and heterogeneous group of cortical interneurons specifically expresses the serotonin receptor 3A (5-HT3AR) but how this diversity emerges during development is poorly understood. Here we use single-cell transcriptomics to identify gene expression patterns operating in Htr3a-GFP+ interneurons during early steps of cortical circuit assembly. We identify three main molecular types of Htr3a-GFP+ interneurons, each displaying distinct developmental dynamics of gene expression. The transcription factor Meis2 is specifically enriched in a type of Htr3a-GFP+ interneurons largely confined to the cortical white matter. These MEIS2-expressing interneurons appear to originate from a restricted region located at the embryonic pallial-subpallial boundary. Overall, this study identifies MEIS2 as a subclass-specific marker for 5-HT3AR-containing interstitial interneurons and demonstrates that the transcriptional and anatomical parcellation of cortical interneurons is developmentally coupled.


Conflict of interest statement

The authors declare no competing financial interests.

Figures

Figure 1
Figure 1. Single-cell RNA-seq identifies molecularly distinct types of Htr3a-GFP+ INs during development.
(a) Cortices and white matter from Htr3a-GFP+ mice were dissected at E18, P2 and P5. (b) Htr3a-GFP+ INs were isolated using fluorescence-activated cell sorting (FACS). (c) Individual Htr3a-GFP+ INs were captured in Fluidigm C1 chips and single cell RNA sequencing (RNA-seq) was performed. (n=89 cells at E18 in two chips; n=76 cells at P2 in one chip; n=78 cells at P5 in two chips). (d) Density clustering by Seurat-based t-Distributed Stochastic Neighbor Embedding (t-SNE) identifies three distinct groups of Htr3a-GFP+ INs across postnatal time-points and an E18 group. (e) Cluster stability analysis using random sampling combined with principal component analysis (PCA) and hierarchical clustering reveals three robust types (colour-coded) of Htr3a-GFP+ INs at P2 and P5. (f) t-SNE analysis indicates that cells belonging to Htr3a-GFP+ interneuron types previously identified independently at P2 and P5 (colour-coded) cluster together. Cells are colour-coded according to cluster assignment obtained using cluster stability analysis. (g) Heat maps displaying top 50 type-enriched genes identified using single-cell differential display (SDCE) at P2 and P5. (h) Violin plots reveal enriched expression of Meis2 in type 1 INs. (i) Time-course expression of interneuron-expressed transcription factors enriched in type 1 INs (Meis2, Etv1, Pbx1 and Sp8) and types 2 and 3 (Prox1, Maf, Npas3 and Nr2f2). SVZ: subventricular zone, IZ: intermediate zone, CTX: cortex, WM: white matter, mle: maximum likelihood estimates. Gene expression levels were obtained using the joint posterior estimation from the SCDE R package. Scale bars: (a) 150 μm at E18, 200 μm at P2 and P5.
Figure 2
Figure 2. White matter (WM) Htr3a-GFP+ INs express MEIS2 at an early postnatal age.
(a) At P5, MEIS2 expression is largely confined to Htr3a-GFP+ INs located in the white matter (upper graph). Only a small fraction of MEIS2+/Htr3a-GFP+ INs are found in deep cortical layers 5/6 (lower graph). (b) Htr3a-GFP+ INs in WM express MEIS2 but not PROX1. (c) A large fraction of MEIS2+/Htr3a-GFP+ INs in the WM co-express ER81. (d) A large fraction of MEIS2+/Htr3a-GFP+ INs in the WM co-express SP8. (e) MEIS2+/Htr3a-GFP+ INs in the WM rarely co-express COUPTFII. CTX: cortex. Graphs display mean±s.e.m. and n=3 brains for each. Scale bars, (ae) 100 μm for low-magnification images; (ae) 20 μm for high-magnification images.
Figure 3
Figure 3. MEIS2+/Htr3a-GFP+ INs are functionally integrated in the juvenile cortical white matter (WM).
(a) At P21 MEIS2 expression is maintained in a large fraction of Htr3a-GFP+ INs located in WM (upper graph; n=3 brains) while only a small fraction of MEIS2+/Htr3a-GFP+ INs are found in deep cortical layers 5/6 (lower graph; n=3 brains). (b) At P21, MEIS2-expressing Htr3a-GFP+ INs in WM do not express PROX1 and COUPTFII but express ER81 and SP8 (c) At P21, MEIS2+/Htr3a-GFP+ INs located in deep cortical layers do not express PROX1 and COUPTFII but express ER81, SP8 and calretinin (CR). (d) Example trace of current clamp recording from a MEIS2+/Htr3a-GFP+ cell, showing its response to a depolarizing current injection. The magnified area depicts the triphasic after-hyperpolarization potential (AHP) observed in some (7 out of 13) recorded cells. (e) Example trace of voltage clamp recording from the same cell, showing long-lasting excitation due to sEPSC in the presence of Gabazine. (f) The sEPSCs were abolished in the presence of CNQX and APV respectively. (g) Example trace of voltage clamp recording from a different MEIS2+/Htr3a-GFP+ cell, showing mixed sEPSCs and sIPSCs in the absence of blockers. (h) Reconstruction of WM Htr3a-GFP+ recorded cell in (e) expressing MEIS2 and extending processes in the white matter, overlying cortical layers 5/6 and striatum (St). LV: lateral ventricle. Graphs display mean±s.e.m. Scale bars, (a) 100 μm for low-magnification image; (ac,h) 20 μm for high-magnification images; (h) 200 μm for reconstruction and low-magnification insert image.
Figure 4
Figure 4. MEIS2+/Htr3a-GFP+ INs are found at the pallial-subpallial boundary (PSB) and in the tangential migratory stream during embryonic development.
(a) At E14, MEIS2 is expressed in PROX1-/Htr3a-GFP+ INs located at the PSB at the level of lateral ganglionic eminence (LGE) (arrowheads). At the level of the caudal ganglionic eminence (CGE), Htr3a-GFP+ INs express PROX1 but only very rarely MEIS2 (n=3 brains). (b) At E18, MEIS2 is expressed in PROX1-/Htr3a-GFP+ INs located at the PSB, in the subventricular zone (SVZ) tangential migratory stream and in the intermediate zone (IZ) (arrowheads; n=3 brains). (c) MEIS2+/Htr3a-GFP+ INs populating the P5 white matter (WM) were co-labelled with BrdU injected between E14 and E18 (n=3 brains for each injection time point). (d) Isochronic grafts of Htr3a-GFP+ INs on E14 cortical slices were performed using PSB or CGE tissues isolated by microdissection. At day in vitro 2 (DIV2), PSB-derived and CGE-derived Htr3a-GFP+ INs were assessed in the developing cortex using IHC and time-lapse imaging. (e) PSB-derived Htr3a-GFP+ INs located in the IZ are MEIS2+ (arrowheads) but not PROX1+ (open arrowheads). In contrast, CGE-derived Htr3a-GFP+ INs located in MZ and CP are PROX1+ (open arrowheads) but not MEIS2+. (f) Time-lapse imaging reveals that PSB-derived Htr3a-GFP+ INs display a significantly lower migratory persistence ratio and speed as compared to CGE-derived Htr3a-GFP+ INs (****P<0.001, *P<0.05, unpaired Student's t-test, n=47 PSB-derived cells in three slices from three brains and n=156 CGE-derived cells in three slices from three brains). Migratory path of cells (cyan arrows) displayed in the time-lapse sequence are depicted in blue in the low magnification image. Graphs display mean±s.e.m. CTX: cortex, dTh: dorsal thalamus, MZ: marginal zone, CP: cortical plate. Scale bars, (a) 500 μm for low-magnification image; (b) 250 μm for low-magnification image; (c) 100 μm for low-magnification image; (f) 50 μm for low-magnification images; (af) 20 μm for high-magnification images.
Figure 5
Figure 5. Htr3a-GFP+ INs expressing COUPTFII are preferentially distributed in cortical layer 1 and express reelin (RELN).
(a) At P5, COUPTFII is preferentially expressed in Htr3a-GFP+ INs located in cortical layer 1 (L1) (arrowheads). (b) Preferential expression of COUPTFII in Htr3a-GFP+ INs located in cortical L1 is maintained at P21 (arrowheads). (c) The Reln transcript is enriched in Nr2f2-expressing type 3 (blue) Htr3a-GFP+ INs (d) RELN is preferentially expressed in COUPTFII+/Htr3a-GFP+ INs located in L1 (arrowheads) compared to COUPTFII-/Htr3a-GFP+ INs. Graphs display mean±s.e.m. and n=3 brains for each. Scale bars, (a,b) 50 μm for low-magnification images, (a,b,d) 25 μm for high-magnification images.

References

    1. Huang Z. J. Toward a genetic dissection of cortical circuits in the mouse. Neuron 83, 1284–1302 (2014). - PMC - PubMed
    1. Kepecs A. & Fishell G. Interneuron cell types are fit to function. Nature 505, 318–326 (2014). - PMC - PubMed
    1. Fishell G. & Rudy B. Mechanisms of inhibition within the telencephalon: ‘Where the Wild Things Are'. Annu. Rev. Neurosci. 34, 535–567 (2011). - PMC - PubMed
    1. Defelipe J. et al. New insights into the classification and nomenclature of cortical GABAergic interneurons. Nat. Rev. Neurosci. 14, 202–216 (2013). - PMC - PubMed
    1. Kessaris N., Magno L., Rubin A. N. & Oliveira M. G. Genetic programs controlling cortical interneuron fate. Curr. Opin. Neurobiol. 26, 79–87 (2014). - PMC - PubMed

Publication types

MeSH terms