DNA methylation and gene expression changes derived from assisted reproductive technologies can be decreased by reproductive fluids
- PMID: 28134613
- PMCID: PMC5340525
- DOI: 10.7554/eLife.23670
DNA methylation and gene expression changes derived from assisted reproductive technologies can be decreased by reproductive fluids
Abstract
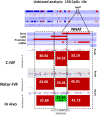
The number of children born since the origin of Assisted Reproductive Technologies (ART) exceeds 5 million. The majority seem healthy, but a higher frequency of defects has been reported among ART-conceived infants, suggesting an epigenetic cost. We report the first whole-genome DNA methylation datasets from single pig blastocysts showing differences between in vivo and in vitro produced embryos. Blastocysts were produced in vitro either without (C-IVF) or in the presence of natural reproductive fluids (Natur-IVF). Natur-IVF embryos were of higher quality than C-IVF in terms of cell number and hatching ability. RNA-Seq and DNA methylation analyses showed that Natur-IVF embryos have expression and methylation patterns closer to in vivo blastocysts. Genes involved in reprogramming, imprinting and development were affected by culture, with fewer aberrations in Natur-IVF embryos. Methylation analysis detected methylated changes in C-IVF, but not in Natur-IVF, at genes whose methylation could be critical, such as IGF2R and NNAT.
Keywords: In vitro fertilization; blastocyst; developmental biology; epigenetics; imprinting; pig; reproductive secretions; stem cells.
Conflict of interest statement
The authors declare that no competing interests exist.
Figures


Similar articles
-
In vitro culture increases the frequency of stochastic epigenetic errors at imprinted genes in placental tissues from mouse concepti produced through assisted reproductive technologies.Biol Reprod. 2014 Feb 6;90(2):22. doi: 10.1095/biolreprod.113.114785. Print 2014 Feb. Biol Reprod. 2014. PMID: 24337315 Free PMC article.
-
The loss of imprinted DNA methylation in mouse blastocysts is inflicted to a similar extent by in vitro follicle culture and ovulation induction.Mol Hum Reprod. 2016 Jun;22(6):427-41. doi: 10.1093/molehr/gaw013. Epub 2016 Feb 7. Mol Hum Reprod. 2016. PMID: 26908643
-
Loss of methylation of H19-imprinted gene derived from assisted reproductive technologies can be mitigated by cleavage-stage embryo transfer in mice.J Assist Reprod Genet. 2019 Nov;36(11):2259-2269. doi: 10.1007/s10815-019-01575-x. Epub 2019 Sep 12. J Assist Reprod Genet. 2019. PMID: 31515683 Free PMC article.
-
Embryo Culture Conditions and the Epigenome.Semin Reprod Med. 2018 May;36(3-04):211-220. doi: 10.1055/s-0038-1675777. Epub 2019 Mar 13. Semin Reprod Med. 2018. PMID: 30866008 Review.
-
DNA Methylation in Embryo Development: Epigenetic Impact of ART (Assisted Reproductive Technologies).Bioessays. 2017 Nov;39(11). doi: 10.1002/bies.201700106. Epub 2017 Sep 21. Bioessays. 2017. PMID: 28940661 Review.
Cited by
-
Production of Genetically Modified Porcine Embryos via Lipofection of Zona-Pellucida-Intact Oocytes Using the CRISPR/Cas9 System.Animals (Basel). 2023 Jan 18;13(3):342. doi: 10.3390/ani13030342. Animals (Basel). 2023. PMID: 36766231 Free PMC article.
-
One-Step In Vitro Generation of ETV2-Null Pig Embryos.Animals (Basel). 2022 Jul 18;12(14):1829. doi: 10.3390/ani12141829. Animals (Basel). 2022. PMID: 35883376 Free PMC article.
-
Assessing the influence of distinct culture media on human pre-implantation development using single-embryo transcriptomics.Front Cell Dev Biol. 2023 Jun 26;11:1155634. doi: 10.3389/fcell.2023.1155634. eCollection 2023. Front Cell Dev Biol. 2023. PMID: 37435029 Free PMC article.
-
Maternal loss of mouse Nlrp2 alters the transcriptome and DNA methylome in GV oocytes and impairs zygotic genome activation in embryos.Clin Epigenetics. 2025 Jun 3;17(1):92. doi: 10.1186/s13148-025-01889-x. Clin Epigenetics. 2025. PMID: 40462191 Free PMC article.
-
Characterization of Metabolic Patterns in Mouse Oocytes during Meiotic Maturation.Mol Cell. 2020 Nov 5;80(3):525-540.e9. doi: 10.1016/j.molcel.2020.09.022. Epub 2020 Oct 16. Mol Cell. 2020. PMID: 33068521 Free PMC article.
References
-
- Asmann YW, Klee EW, Thompson EA, Perez EA, Middha S, Oberg AL, Therneau TM, Smith DI, Poland GA, Wieben ED, Kocher JP. 3' tag digital gene expression profiling of human brain and universal reference RNA using Illumina genome analyzer. BMC Genomics. 2009;10:531. doi: 10.1186/1471-2164-10-531. - DOI - PMC - PubMed
-
- Bauer BK, Isom SC, Spate LD, Whitworth KM, Spollen WG, Blake SM, Springer GK, Murphy CN, Prather RS. Transcriptional profiling by deep sequencing identifies differences in mRNA transcript abundance in in vivo-derived versus in vitro-cultured porcine blastocyst stage embryos. Biology of Reproduction. 2010;83:791–798. doi: 10.1095/biolreprod.110.085936. - DOI - PubMed
-
- Bo G, Mapletoft R. Evaluation and classification of bovine embryos. Animal Reproduction. 2013;10:344–348.
Publication types
MeSH terms
Substances
Grants and funding
LinkOut - more resources
Full Text Sources
Other Literature Sources
Medical
Miscellaneous

