
Mutations in tropomyosin 4 underlie a rare form of human macrothrombocytopenia

Irina Pleines et al. J Clin Invest. .

Abstract

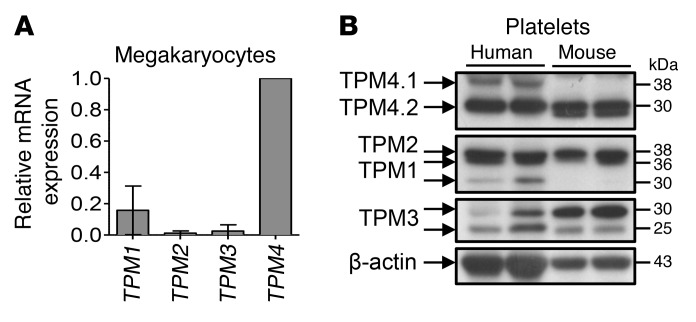
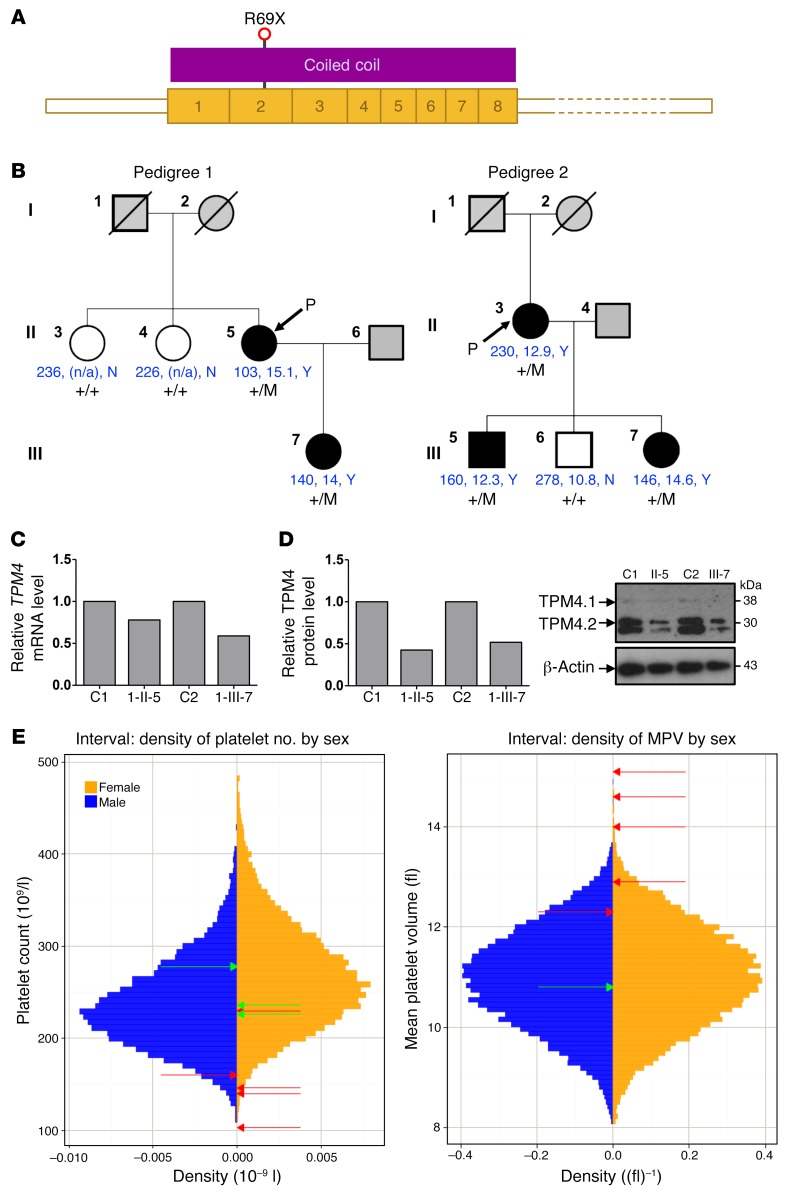
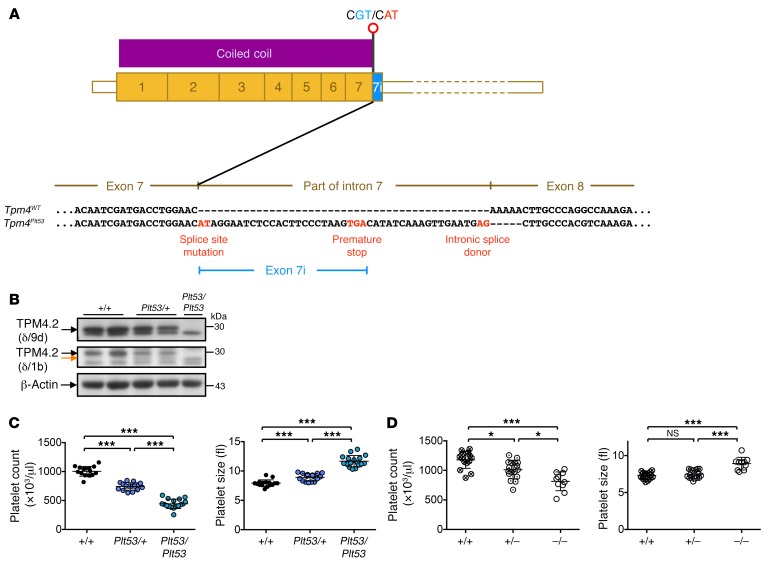
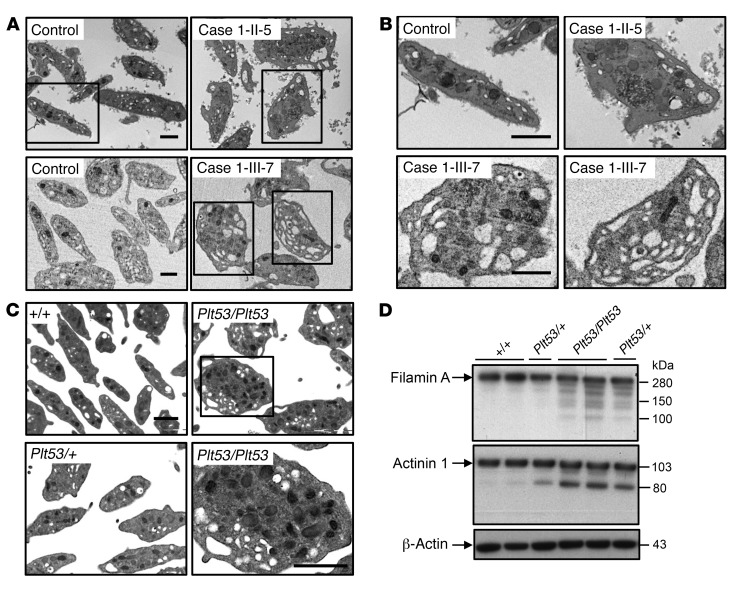
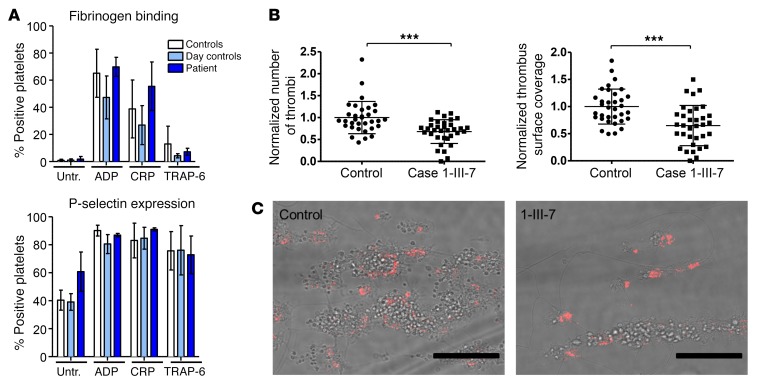
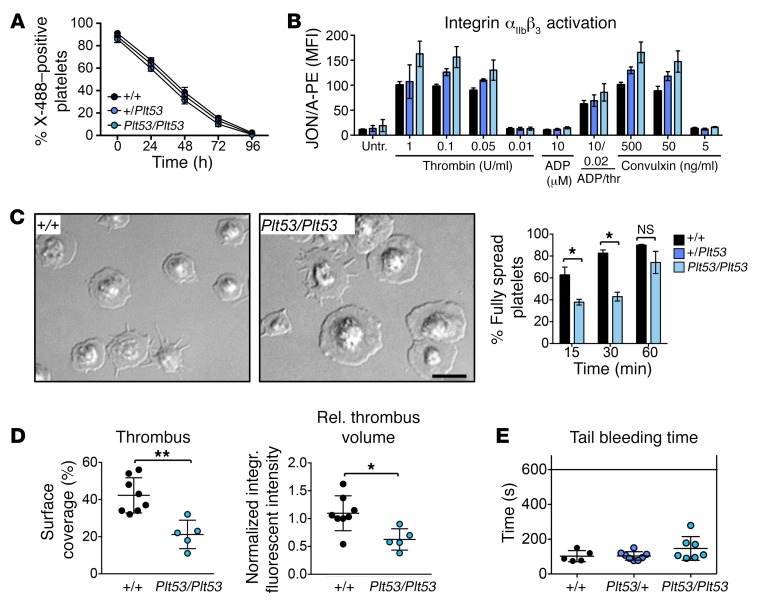
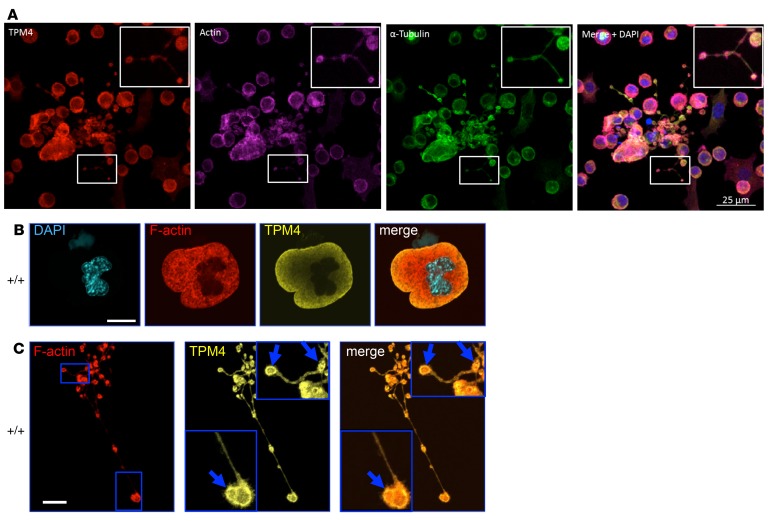
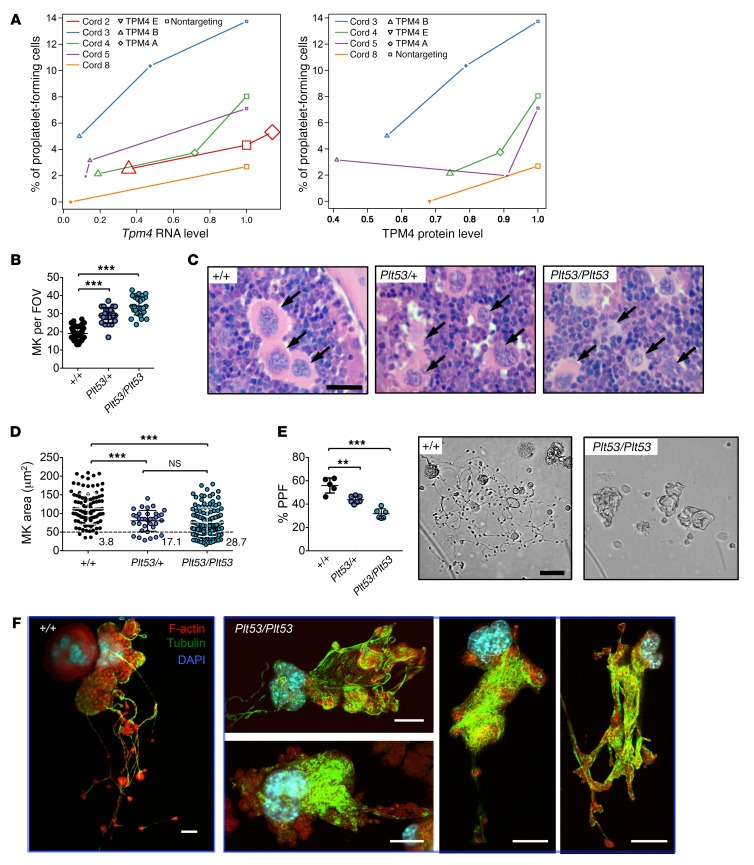
Platelets are anuclear cells that are essential for blood clotting. They are produced by large polyploid precursor cells called megakaryocytes. Previous genome-wide association studies in nearly 70,000 individuals indicated that single nucleotide variants (SNVs) in the gene encoding the actin cytoskeletal regulator tropomyosin 4 (TPM4) exert an effect on the count and volume of platelets. Platelet number and volume are independent risk factors for heart attack and stroke. Here, we have identified 2 unrelated families in the BRIDGE Bleeding and Platelet Disorders (BPD) collection who carry a TPM4 variant that causes truncation of the TPM4 protein and segregates with macrothrombocytopenia, a disorder characterized by low platelet count. N-Ethyl-N-nitrosourea-induced (ENU-induced) missense mutations in Tpm4 or targeted inactivation of the Tpm4 locus led to gene dosage-dependent macrothrombocytopenia in mice. All other blood cell counts in Tpm4-deficient mice were normal. Insufficient TPM4 expression in human and mouse megakaryocytes resulted in a defect in the terminal stages of platelet production and had a mild effect on platelet function. Together, our findings demonstrate a nonredundant role for TPM4 in platelet biogenesis in humans and mice and reveal that truncating variants in TPM4 cause a previously undescribed dominant Mendelian platelet disorder.


Conflict of interest statement

Conflict of interest: The authors have declared that no conflict of interest exists.

Figures

Figure 1
Figure 1. Tropomyosin expression in human and mouse.
(A) Multiple TPMs are expressed in human megakaryocytes. Relative TPM mRNA expression of human cord blood–derived megakaryocytes was evaluated by real-time quantitative PCR. Data are presented as mean ± SD of 3 independent experiments. (B) Comparison of tropomyosin (TPM1–4) protein expression between human and WT mouse platelets. Top panel: The 30-kDa TPM4 protein isoform (TPM4.2) is the main isoform in both human and mouse platelets. Human platelets additionally express low amounts of the 38-kDa TPM4 isoform (TPM4.1). Bottom panel: β-Actin loading control.
Figure 2
Figure 2. TPM4 mutation causes macrothrombocytopenia in humans.
(A) Schematic representation of the major megakaryocyte TPM4 transcript ENST00000300933, which is predicted to encode the 248–amino acid TPM4 protein (UniProt ID P67936). R69 is transcribed from the second exon of the transcript and is 68 amino acids from the amino-terminus of TPM4. R69X is predicted to cause expression of a truncated TPM4 protein. (B) Family trees for pedigree 1 and pedigree 2 with the TPM4 variant are depicted, including the platelet count, platelet volume, and presence/absence (Y/N) of macrothrombocytes when visualized by electron microscopy (shown in blue). Filled symbols: macrothrombocytopenia; gray symbols, unknown; open symbols: normal platelet count and volume and absence of macrothrombocytes. +/M, heterozygous; +/+, WT. (C) Platelet TPM4 RNA levels measured by RT-PCR using GAPDH as housekeeping gene. Graph depicts representative data from a total of n = 3 measurements from 1 (case 1-II-5) or 3 (case 1-III-7) patient samples. (D) Platelet TPM4 protein is reduced in heterozygous carriers of the TPM4 variant. Graph depicts representative data from a total of n = 3 measurements from 1 (case 1-II-5) or 3 (case 1-III-7) samples. Left: Densitometry analysis performed using ImageJ. Right: Protein levels of platelet TPM4 in controls and cases 1-II-5 and 1-III-7. β-Actin was included as an internal loading control. Similar results were obtained when GAPDH was used as a loading control (not shown). (E) Sex-stratified histograms of platelet count (PLT) and mean platelet volume measurements obtained using a Sysmex hematology analyzer from 48,345 blood donors from the INTERVAL study after adjustment for technical artifacts. The red arrows superimposed on the histograms indicate the sex of and values for patients with the truncating variant in TPM4. The green arrows indicate the sex of and values for relatives homozygous for the corresponding WT allele.
Figure 3
Figure 3. Loss of function at the Tpm4 locus causes macrothrombocytopenia in mice.
(A) Schematic representation of the Plt53 mutation (A to G substitution at nucleotide g.72,147,268) in the first dinucleotide of the donor splice site in exon 7 of Tpm4, which is predicted to result in a protein bearing 8 intron-encoded amino acids followed by premature truncation due to the presence of an in-frame stop codon at nucleotide g.72,147,291. (B) Top panel: Use of an antibody directed against the TPM4 C-terminus (δ/9d, AB5449, Millipore) demonstrates that TPM4.2 is not expressed in Tpm4Plt53 platelets. Middle panel: Use of an antibody directed against the TPM4 N-terminus (δ/1b) reveals residual expression of a truncated TPM4.2 protein from the Tpm4Plt53 allele (orange arrow). Bottom panel: β-Actin loading control. Results are representative of 3 independent experiments. (C) The Plt53 mutation causes macrothrombocytopenia. Reduced platelet count and increased platelet size in Tpm4Plt53/+ and Tpm4Plt53/Plt53 mice compared with Tpm4+/+ mice (n = 17). (D) Platelet count and size in Tpm4.2 WT (+/+), heterozygous (+/–), and homozygous knockout (–/–) mice (n = 10–15) on a C57BL/6 background. Measurements were performed using an Advia hematology analyzer. One-way ANOVA, unpaired 2-tailed Student’s t test with Bonferroni correction for multiple comparisons. *P < 0.05, ***P < 0.001.
Figure 4
Figure 4. TPM4 insufficiency results in altered platelet morphology.
(A and B) Ultrastructure of platelets from cases 1-II-5 and 1-III-7 carrying the variant, showing the presence of large platelets with numerous vacuoles indicating increased fragility, contrasting the normal discoid platelet appearance in controls. (A) Overview. (B) Detail. Scale bars: 1 μm. (C) Representative electron microscopic pictures illustrating increased size and fragile appearance in Tpm4Plt53/Plt53 and Tpm4Plt53/+ compared with Tpm4+/+ platelets (n = 2; each sample was pooled from 2 individuals). Scale bars: 1 μm. (D) Western blot showing the presence of degraded filamin A and actinin 1 in Tpm4Plt53/Plt53 and Tpm4Plt53/+ compared with Tpm4+/+ platelets. Results are representative of 2 independent experiments. Bottom panel: β-Actin loading control.
Figure 5
Figure 5. The function of human platelets is mildly affected by reduced TPM4 expression.
(A) Platelet function testing measuring fibrinogen binding (top) and P-selectin expression (bottom) (percentage of positive platelets) after treatment with final concentrations of 0.0005 μM ADP, 0.3 μg/ml CRP-XL, or 0.8 μM TRAP-6. Depicted are the results obtained on 3 different days (2 technical replicates) for the day control and the patient (case 1-III-7). A bank of 20 controls is shown in white. (B and C) Thrombus formation on collagen under flow (shear rate 1,600/s). (B) Normalized thrombus number and coverage after blood perfusion through a collagen-coated chamber; 6 images captured per run, 2 runs per sample using 2 different samples. (C) Representative images of thrombi stained with P-selectin captured using fluorescence microscopy (EVOS system; Advanced Microscopy Group). Scale bars: 50 μm. Unpaired 2-tailed Student’s t test, ***P < 0.001.
Figure 6
Figure 6. The function of mouse platelets is mildly affected by reduced TPM4 expression.
(A) Normal in vivo lifespan of Tpm4Plt53/+ and Tpm4Plt53/Plt53 compared with Tpm4+/+ platelets. Platelets were labeled by i.v. injection with X-488 antibody (Emfret), and the percentage of fluorescent platelets was monitored over time by flow cytometry (n = 5, representative of 2 independent experiments). (B) Flow cytometric measurement of integrin αIIbβ3 activation (JON/A–PE antibody) in Tpm4+/+, Tpm4Plt53/+, and Tpm4Plt53/Plt53 platelets after activation with the depicted agonists (n = 4, representative of 3 independent experiments). (C) Platelet spreading. Left: Representative differential interference microscopy images of Tpm4+/+ and Tpm4Plt53/Plt53 platelets spread on fibrinogen (100 μg/ml) after activation with 0.01 U/ml thrombin. Scale bar: 5 μm. Right: Percentage of fully spread Tpm4+/+ (black) and Tpm4Plt53/Plt53 (blue) platelets at 15, 30, and 60 minutes after induction of the spreading process (n = 3). Results are representative of 3 independent experiments. (D) Thrombus formation on collagen under flow (shear rate 1,000/s). Left: Mean surface covered with thrombi. Right: Relative platelet deposition, as measured by integrated fluorescent intensity per square millimeter ± SD. Each dot represents an individual. Results are pooled from 2 independent experiments. (E) Tail bleeding times in Tpm4Plt53/+ (blue) and Tpm4Plt53/Plt53 (light blue) compared with Tpm4+/+ (black) mice. Each dot represents an individual. Unpaired 2-tailed Student’s t test, *P < 0.05, **P < 0.01.
Figure 7
Figure 7. TPM4 localizes to proplatelets in human and mouse megakaryocytes.
(A) Immunolabeling of TPM4 (red), F-actin (purple), α-tubulin (green), and merge of TPM4/F-actin/α-tubulin and DAPI, in control human proplatelets. Scale bar: 25 μm. (B) Investigation of TPM4 (yellow) and F-actin (red) localization of mouse fetal liver cell–derived megakaryocytes by confocal immunofluorescence microscopy. TPM4 (yellow) localizes to the periphery in mature round WT Tpm4+/+ megakaryocytes. (C) TPM4 is enriched in proplatelet tips and colocalizes with F-actin (depicted by arrows). Scale bars: 20 μm.
Figure 8
Figure 8. TPM4 dose-dependently facilitates proplatelet formation.
(A) Logistic regression analysis showing that the percentage of proplatelet-forming cells decreases with Tpm4 RNA (left; effect 1.22, P < 2–16) and protein (right; effect 2.54, P = 6.23–12) levels. Node size reflects the number of cells counted (at least 200). (B) Increased number of megakaryocytes (MK) in bone marrow from Tpm4Plt53/+ and Tpm4Plt53/Plt53 mice. Shown are results from 50 fields of view (FOV) (Tpm4+/+ and Tpm4Plt53/+) and 28 FOV (Tpm4Plt53/Plt53). (C) Representative pictures of H&E-stained bone marrow sections show altered morphology (smaller size, irregular shape) of Tpm4Plt53/+ and Tpm4Plt53/Plt53 megakaryocytes compared with the control (n = 3). Arrows indicate megakaryocytes. Scale bar: 15 μm. (D) Decreased size of Tpm4 mutant megakaryocytes compared with WT counterparts. n = 105 (Tpm4+/+), n = 35 (Tpm4Plt53/+), n = 125 (Tpm4Plt53/Plt53). (E) Left: Decreased proplatelet formation (PPF) of fetal liver cell–derived Tpm4Plt53/+ and Tpm4Plt53/Plt53 megakaryocytes (n = 5–6). Each dot represents the mean of 1 individual sample (at least 12 visual fields counted). Right: Representative light microscopy pictures showing altered morphology and decreased branch formation of Tpm4Plt53/+ and Tpm4Plt53/Plt53 compared with Tpm4+/+ megakaryocytes. Scale bar: 50 μm. (F) Investigation of F-actin (red) and tubulin (green) distribution of proplatelet-forming Tpm4+/+ (left) and Tpm4Plt53/Plt53 (right) megakaryocytes by confocal immunofluorescence microscopy. Nuclei were stained with DAPI (blue). Scale bars: 20 μm. (B and E) One-way ANOVA, unpaired 2-tailed Student’s t test with Bonferroni correction for multiple comparisons. (D) One-way ANOVA, Mann-Whitney test with Bonferroni correction for multiple comparisons. **P < 0.01, ***P < 0.001.
Figure 9
Figure 9. TPM4-interacting proteins in megakaryocytes and platelets.
(A) Investigation of cofilin and P-cofilin expression in Tpm4Plt53/Plt53 platelets (left) and fetal liver cell–derived megakaryocytes (right) by Western blot. Blots are representative of 2–3 individual experiments. (B) Densitometry analysis shows decreased levels of phosphorylated (inactive) cofilin in Tpm4Plt53/+ and Tpm4Plt53/Plt53 compared with Tpm4+/+ platelets (n = 6; results were pooled from 2 separate experiments). (C) Investigation of NMMHC-IIa (green) and F-actin (red) localization in fetal liver cell–derived Tpm4+/+ and Tpm4Plt53/Plt53 megakaryocytes by confocal immunofluorescence microscopy. Scale bar: 20 μm. One-way ANOVA, unpaired 2-tailed Student’s t test with Bonferroni correction for multiple comparisons. *P < 0.05.

Similar articles

Cited by

  • Role of Rho-GTPases in megakaryopoiesis.
    Vainchenker W, Arkoun B, Basso-Valentina F, Lordier L, Debili N, Raslova H. Vainchenker W, et al. Small GTPases. 2021 Sep-Nov;12(5-6):399-415. doi: 10.1080/21541248.2021.1885134. Epub 2021 Feb 11. Small GTPases. 2021. PMID: 33570449 Free PMC article. Review.
  • Whole-genome sequencing of patients with rare diseases in a national health system.
    Turro E, Astle WJ, Megy K, Gräf S, Greene D, Shamardina O, Allen HL, Sanchis-Juan A, Frontini M, Thys C, Stephens J, Mapeta R, Burren OS, Downes K, Haimel M, Tuna S, Deevi SVV, Aitman TJ, Bennett DL, Calleja P, Carss K, Caulfield MJ, Chinnery PF, Dixon PH, Gale DP, James R, Koziell A, Laffan MA, Levine AP, Maher ER, Markus HS, Morales J, Morrell NW, Mumford AD, Ormondroyd E, Rankin S, Rendon A, Richardson S, Roberts I, Roy NBA, Saleem MA, Smith KGC, Stark H, Tan RYY, Themistocleous AC, Thrasher AJ, Watkins H, Webster AR, Wilkins MR, Williamson C, Whitworth J, Humphray S, Bentley DR; NIHR BioResource for the 100,000 Genomes Project; Kingston N, Walker N, Bradley JR, Ashford S, Penkett CJ, Freson K, Stirrups KE, Raymond FL, Ouwehand WH. Turro E, et al. Nature. 2020 Jul;583(7814):96-102. doi: 10.1038/s41586-020-2434-2. Epub 2020 Jun 24. Nature. 2020. PMID: 32581362 Free PMC article.
  • Tropomyosin Tpm3.1 Is Required to Maintain the Structure and Function of the Axon Initial Segment.
    Abouelezz A, Stefen H, Segerstråle M, Micinski D, Minkeviciene R, Lahti L, Hardeman EC, Gunning PW, Hoogenraad CC, Taira T, Fath T, Hotulainen P. Abouelezz A, et al. iScience. 2020 May 22;23(5):101053. doi: 10.1016/j.isci.2020.101053. Epub 2020 Apr 12. iScience. 2020. PMID: 32344377 Free PMC article.
  • A mutation of beta-tropomyosin gene in a Chinese family with distal arthrogryposis type I.
    Jin JY, Wu PF, Fan LL, Yu F, Li JJ, Fan XF, Huang H, Zeng L, Tang JY, Xiang R. Jin JY, et al. Int J Clin Exp Pathol. 2017 Nov 1;10(11):11137-11142. eCollection 2017. Int J Clin Exp Pathol. 2017. PMID: 31966463 Free PMC article.
  • Inherited Thrombocytopenia: Update on Genes and Genetic Variants Which may be Associated With Bleeding.
    Almazni I, Stapley R, Morgan NV. Almazni I, et al. Front Cardiovasc Med. 2019 Jun 19;6:80. doi: 10.3389/fcvm.2019.00080. eCollection 2019. Front Cardiovasc Med. 2019. PMID: 31275945 Free PMC article. Review.

References

    1. Nieswandt B, Pleines I, Bender M. Platelet adhesion and activation mechanisms in arterial thrombosis and ischaemic stroke. J Thromb Haemost. 2011;9(suppl 1):92–104. - PubMed
    1. Patel SR, Hartwig JH, Italiano JE. The biogenesis of platelets from megakaryocyte proplatelets. J Clin Invest. 2005;115(12):3348–3354. doi: 10.1172/JCI26891. - DOI - PMC - PubMed
    1. Machlus KR, Italiano JE. The incredible journey: From megakaryocyte development to platelet formation. J Cell Biol. 2013;201(6):785–796. doi: 10.1083/jcb.201304054. - DOI - PMC - PubMed
    1. Johnson AD. The genetics of common variation affecting platelet development, function and pharmaceutical targeting. J Thromb Haemost. 2011;9(suppl 1):246–257. - PMC - PubMed
    1. Gieger C, et al. New gene functions in megakaryopoiesis and platelet formation. Nature. 2011;480(7376):201–208. doi: 10.1038/nature10659. - DOI - PMC - PubMed