. 2017 Mar 1;127(3):830-842.
doi: 10.1172/JCI87583. Epub 2017 Jan 30.

Dosage-dependent copy number gains in E2f1 and E2f3 drive hepatocellular carcinoma

Dosage-dependent copy number gains in E2f1 and E2f3 drive hepatocellular carcinoma

Lindsey N Kent et al. J Clin Invest. .

Abstract

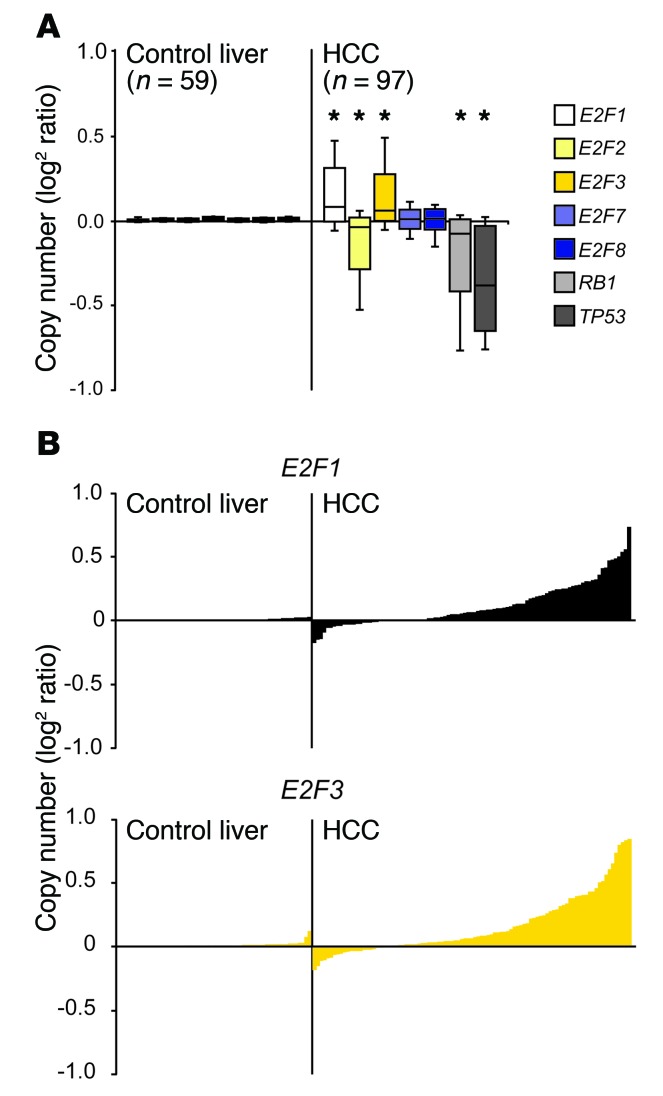
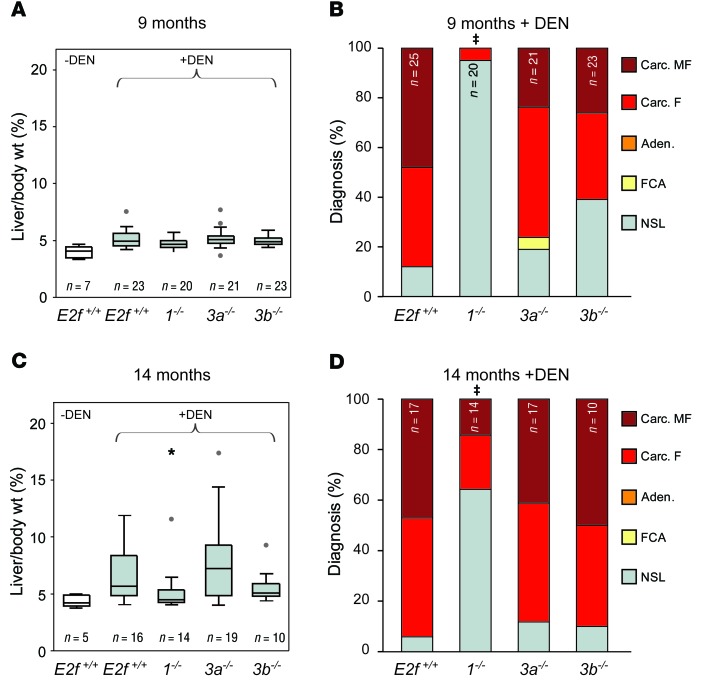
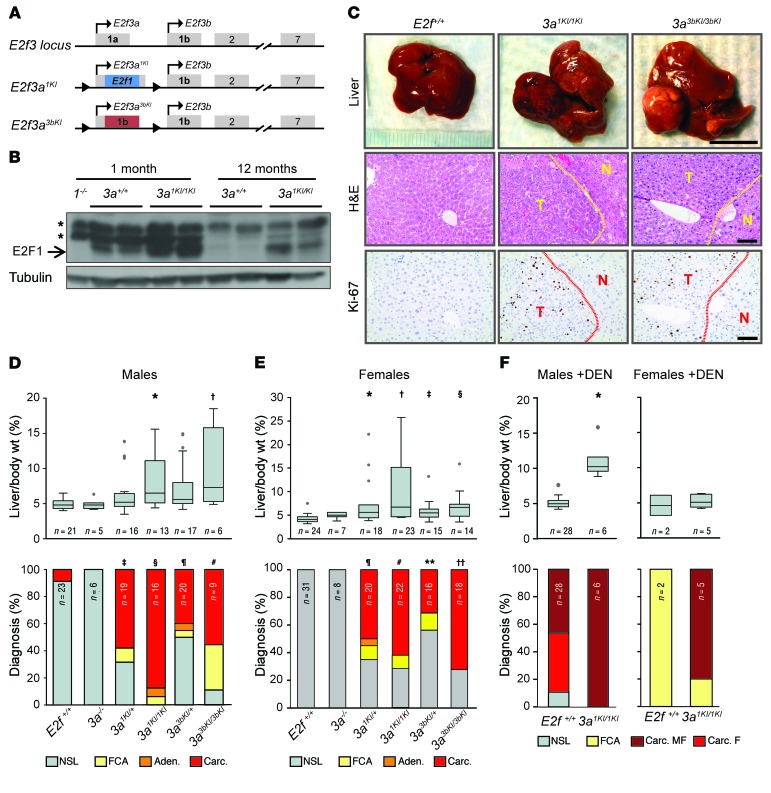
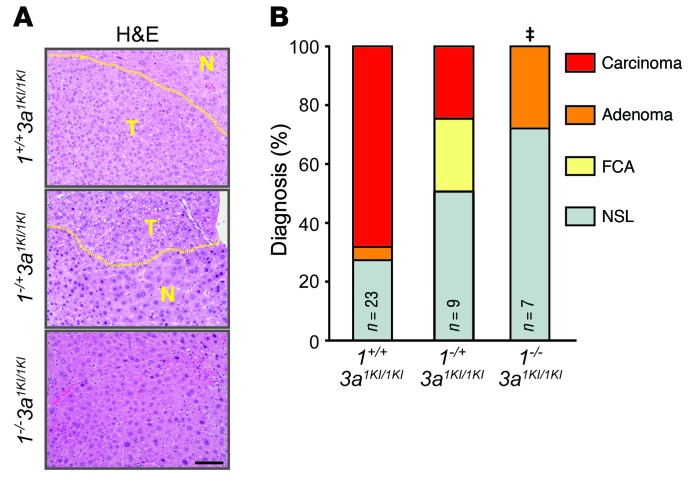
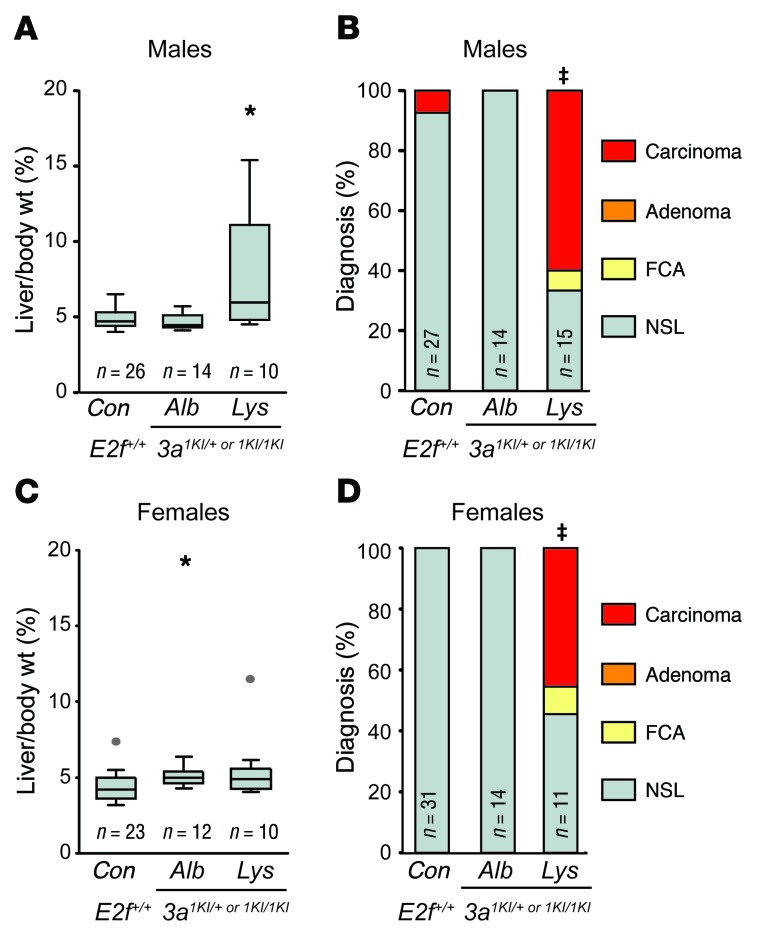
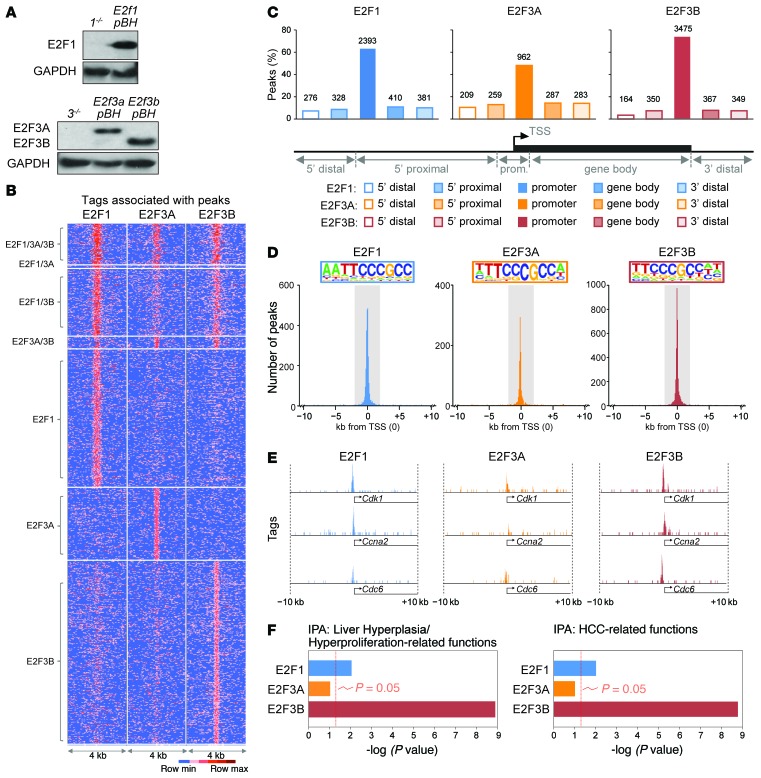
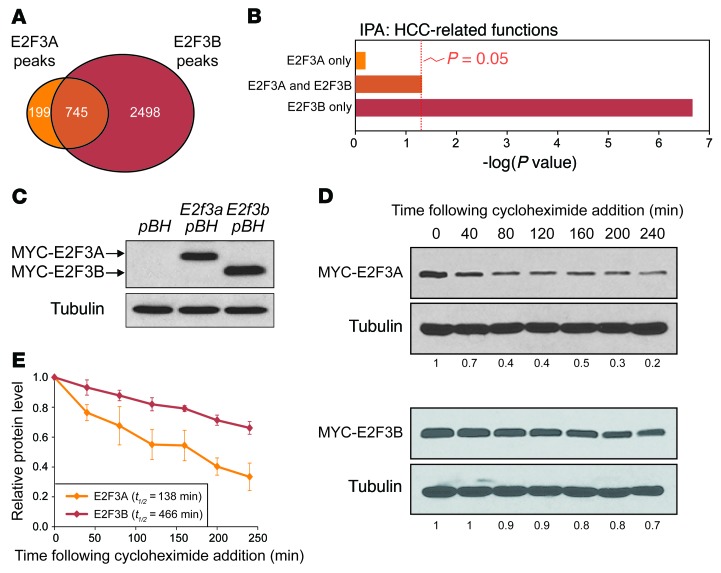
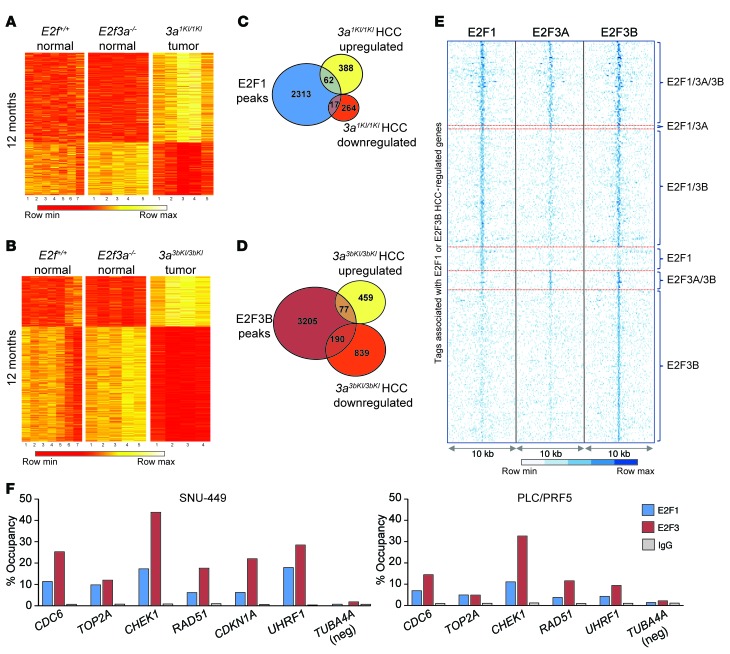
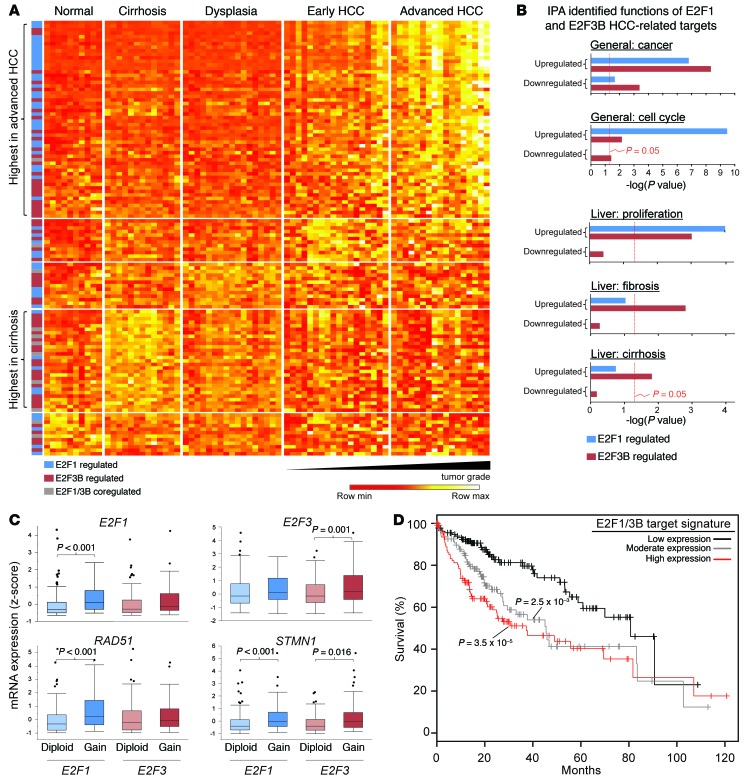
Disruption of the retinoblastoma (RB) tumor suppressor pathway, either through genetic mutation of upstream regulatory components or mutation of RB1 itself, is believed to be a required event in cancer. However, genetic alterations in the RB-regulated E2F family of transcription factors are infrequent, casting doubt on a direct role for E2Fs in driving cancer. In this work, a mutation analysis of human cancer revealed subtle but impactful copy number gains in E2F1 and E2F3 in hepatocellular carcinoma (HCC). Using a series of loss- and gain-of-function alleles to dial E2F transcriptional output, we have shown that copy number gains in E2f1 or E2f3b resulted in dosage-dependent spontaneous HCC in mice without the involvement of additional organs. Conversely, germ-line loss of E2f1 or E2f3b, but not E2f3a, protected mice against HCC. Combinatorial mapping of chromatin occupancy and transcriptome profiling identified an E2F1- and E2F3B-driven transcriptional program that was associated with development and progression of HCC. These findings demonstrate a direct and cell-autonomous role for E2F activators in human cancer.


Conflict of interest statement

Authorship note: L.N. Kent, S. Bae, and S.Y. Tsai contributed equally to this work. Conflict of interest: The authors have declared that no conflict of interest exists.

Figures

Figure 1
Figure 1. Copy number gains in E2F1 and E2F3 in human primary liver cancer.
(A) Box plots illustrating copy number variations in E2F pathway genes in normal liver and HCC samples using values from the TCGA database. The center lines in boxes represent the median. The boxes represent the first and third quartiles, and the whiskers represent the highest and lowest values. *P < 0.001, 2-sided Student’s t test vs. control liver. (B) An alternate view of the box plots shown in A. Levels of copy number variations are shown on the y axis and individual patients on the x axis.
Figure 2
Figure 2. Ablation of E2f1 or E2f3b, but not E2f3a, decreases HCC severity in mice.
(A) Box plots showing the ratio of liver vs. body weight (liver/body wt.) of 9-month-old WT (E2f+/+) and E2f knockout male mice. Non–DEN-treated cohorts are in white, and DEN-treated are shown in gray. The center lines in boxes represent the median. The box represents the first and third quartiles, and the whiskers represent the highest and lowest values. Outliers are represented by gray dots. (B) Histopathological classification of mice from A. Carc. MF, carcinoma multifocal; Carc. F, carcinoma focal; Aden, adenoma; FCA, focal cellular atypia; NSL, no significant lesions. Fisher’s exact tests with Bonferroni’s correction for multiple tests. P ≤ 0.001, carcinoma (focal/multifocal) vs. E2f+/+. (C) Box plots showing liver/body weight of 14-month-old male mice. Non–DEN-treated cohorts are in white, and DEN-treated are shown in gray. *P = 0.040, 1–/– vs. E2f+/+ liver; Wilcoxon method with Bonferroni’s correction. (D) Histopathological classification of mice from C. Fisher’s exact tests with Bonferroni’s correction. P ≤ 0.003, carcinoma vs. E2f+/+.
Figure 3
Figure 3. Copy number increases in E2f1 or E2f3b result in HCC.
(A) Diagram of the murine E2f3 locus and E2f knockin alleles where the coding region of E2f1 or exon 1 of E2f3b has been inserted into the first exon of E2f3a, resulting in the loss of E2f3a and expression of E2f1 (3a1KI) or E2f3b (3a3bKI) driven by the E2f3a promoter. (B) Immunoblot of 1- and 12-month-old liver extracts from 3a1KI/1KI mice. The blot was probed with an E2F1-specific antibody. Liver from 1–/– mice was used to validate the antibody. Asterisks indicate nonspecific bands, and tubulin was used as a loading control. (C) Representative pictures of livers from 12- to 18-month-old mice (top), sections stained with H&E (middle), or probed with Ki-67–specific antibodies (bottom). Areas of HCC are outlined by dotted lines. T, tumor; N, normal liver. Scale bars: 1 cm (top); 100 μm (middle and bottom). (D) Box plots showing the liver/body weight of male mice from C (top): *P = 0.012, E2f3a1KI/1KI vs. E2f+/+; P = 0.043, E2f3a3bKI/3bKI vs. E2f+/+, Wilcoxon method with Bonferroni’s correction for multiple tests. Histopathological classification (bottom): P = 0.002, E2f3a1KI/+ vs. E2f+/+; §P < 0.001, E2f3a1KI/1KI vs. E2f+/+; P = 0.032, E2f3a3bKI/+ vs. E2f+/+; #P = 0.02, E2f3a3bKI/3bKI vs. E2f+/+, Fisher’s exact tests with Bonferroni’s correction. (E) Box plots showing the liver/body weight of female mice from C (top): *P = 0.002, E2f3a1KI/+ vs. E2f+/+; P = 0.001, E2f3a1KI/1KI vs. E2f+/+; P = 0.015, E2f3a3bKI/+ vs. E2f+/+; §P = 0.005, E2f3a3bKI/3bKI vs. E2f+/+, Wilcoxon method with Bonferroni’s correction. Histopathological classification (bottom): P < 0.001, E2f3a1KI/+ vs. E2f+/+ liver; #P < 0.001, E2f3a1KI/1KI vs. E2f+/+ liver; **P = 0.014, E2f3a3bKI/+ vs. E2f+/+ liver; ††P < 0.001, E2f3a3bKI/3bKI vs. E2f+/+ liver, Fisher’s exact tests with Bonferroni’s correction. (F) Box plots showing the liver/body weight (top) or bar graph showing histopathological classification (bottom) of DEN-treated E2f+/+ and 3a1KI/1KI male mice at 9 months of age.
Figure 4
Figure 4. E2f1 gene dosage affects liver cancer in 3a1KI/1KI mice.
(A) Representative photographs of H&E-stained livers from 1+/+3a1KI/1KI, 1–/+3a1KI/1KI, and 1–/–3a1KI/1KI mice at 1 year. Areas of HCC are outlined by dotted lines. Scale bar: 100 μm. (B) Histopathological classification of livers of mice from A. Fisher’s exact tests with Bonferroni’s correction for multiple tests. P = 0.019, carcinoma compared with 1+/+3a1KI/1KI.
Figure 5
Figure 5. Oncogenic functions of E2f1 and E2f3b are cell autonomous.
(A) Box plots showing the liver/body weight of 12- to 18-month-old male mice in which the knockin allele or alleles have been deleted in hepatocytes or macrophages using Alb-Cre or Lys-Cre, respectively. Wilcoxon method with Bonferroni’s correction for multiple tests. *P < 0.001 vs. control. (B) Histopathological classification of livers from A. Fisher’s exact tests with Bonferroni’s correction. P = 0.001, carcinoma vs. control. (C) Box plots showing the liver/body weight of 12- to 18-month-old female mice. Wilcoxon method with Bonferroni’s correction. *P < 0.012 vs. control. (D) Histopathological classification of livers from C. Fisher’s exact tests with Bonferroni’s correction. P = 0.001, carcinoma vs. control.
Figure 6
Figure 6. Identification of E2F targets by ChIP sequencing.
(A) Immunoblot of protein lysates from MEFs expressing the indicated E2Fs using the pBABE-Hygro (pBH) vector. E2F1 (E2f1 pBH), E2F3A (E2f3a pBH), and E2F3B (E2f3b pBH); 1–/– and 3–/– MEFs are shown as negative controls. GAPDH was used as a loading control. (B) Sequence tag-density heat map showing the distribution of tags for all E2F1, E2F3A, and E2F3B peaks. (C) Percentages of E2F1, E2F3A, and E2F3B peaks in different gene regions. Gene regions were defined by distance from TSS (TSS = 0) as follows: 5′ distal (–50 Gb to –50 kb), 5′ proximal (–50 kb to -2 kb), promoter (–2 kb to +2 kb), gene body (+2kb to end of transcript), 3′ distal (end of transcript to +30 Gb). Number of peaks is indicated above each bar. (D) Graph depicting the number of peaks for E2F1, E2F3A, and E2F3B identified by ChIP-seq and their location relative to the TSS. The promoter region ( ± 2 kb from the TSS) is highlighted in gray, and the top binding motif identified by de novo HOMER within the promoter region is included in color inserts. (E) E2F1, E2F3A, and E2F3B occupancy on selected gene promoters shown at the same scale. (F) Gene ontology using IPA software depicts the estimated contribution of E2F1, E2F3A, or E2F3B targets to liver hyperplasia and hyperproliferation (left) or HCC-related functions (right). Bars indicate the Benjamini-Hochberg adjusted P value; the threshold of P = 0.05 is shown.
Figure 7
Figure 7. Measurement of E2F3A and E2F3B protein stability.
(A) Venn diagram illustrating the overlap of genes that are bound by E2F3A and E2F3B in the promoter region (±2 kb from the TSS). (B) Gene ontology using IPA software showing the estimated contribution of different groups of E2F3A and E2F3B target genes identified in A to HCC-related functions. Bars indicate the Benjamini-Hochberg adjusted P value; the threshold of P = 0.05 is shown. (C) Immunoblot showing the stable overexpression of MYC-tagged E2F3A or E2F3B in MEFs. Antibodies against the MYC epitope were used to detect tagged proteins, and tubulin was used as a loading control. (D) Cycloheximide time course of MEFs stably overexpressing MYC-tagged E2F3A or E2F3B. Protein levels of E2F3A and E3F3B were measured by Western blotting at the indicated time points following cycloheximide treatment (10 μg/ml). Antibodies against the MYC epitope were used to detect tagged proteins. Tubulin was used as a loading control. Quantification of E2F3A and E2F3B protein relative to time = 0 is indicated below each blot. (E) Quantification of E2F3A and E2F3B protein stability as described in D. Means of 3 experiments are shown. Error bars indicate ± SEM. t1/2 is the estimated half-life of the protein. The stability of E2F3A and E2F3B was found to be different by Wilcoxon signed rank test using the average of each time point (P < 0.05).
Figure 8
Figure 8. Intersection of gene-expression profiling and chromatin binding identifies E2F1 and E2F3B targets.
(A) Heat map of Affymetrix microarray data showing differentially expressed genes in 3a1KI/1KI liver tumors when compared with normal liver samples from E2f+/+ and 3a–/– age-matched controls. Differentially expressed genes are defined as having a fold change of 1.5 or more (P ≤ 0.05) relative to 3a–/– samples. (B) Heat map of Affymetrix microarray data showing differentially expressed genes in 3a3bKI/3bKI liver tumors when compared with normal liver samples from E2f+/+ and 3a–/– age-matched controls. Differentially expressed genes are defined as having a fold change of 1.5 or more (P ≤ 0.05) relative to 3a–/– samples. (C) Venn diagram illustrating the overlap of E2F1-specific promoter peaks with upregulated or downregulated genes in 3a1KI/1KI liver tumors identified in A. (D) Venn diagram illustrating the overlap of E2F3B-specific promoter peaks with upregulated or downregulated genes in 3a3bKI/3bKI liver tumors identified in B. (E) Sequence tag-density heat map showing the distribution of E2F1, E2F3A, and E2F3B binding to targets identified in C and D (overlapping groups). (F) ChIP-qPCR validation using E2F1, E2F3, or IgG antibodies in SNU-449 and PLC/PRF5 HCC-derived cells. Occupancy of E2Fs on selected target promoters is shown. A nonpromoter region of TUBA4A (TUBA4A neg) was used as a negative control. Primers were designed to amplify ChIP-seq–identified peak regions.
Figure 9
Figure 9. Association of the expression of E2F1 and E2F3B targets with human HCC.
(A) Heat map showing the expression of E2F1 and E2F3B upregulated targets in normal and diseased (cirrhosis, dysplasia, early or advanced HCC) human livers. Genes are grouped based on median expression values per patient group. Genes with the highest median expression in advanced HCC and cirrhosis are denoted on the left. (B) Gene ontology using IPA software showing the estimated contribution of E2F1 and E2F3B targets identified in Figure 8 to functions related to cancer, cell cycle, proliferation, fibrosis, and cirrhosis. Bars indicate the Benjamini-Hochberg adjusted P value; the threshold of P = 0.05 is shown. (C) Expression of E2F1 and E2F3B targets in human HCC samples with normal or increased copy numbers of E2F1 and E2F3. E2F1 diploid, 122 samples; gain, 62 samples. E2F3 diploid, 102 samples; gain, 80 samples. Wilcoxon rank sum test Benjamini-Hochberg corrected P values are indicated. (D) Kaplan-Meier plots evaluating the survival time of patients with low to high E2F1/3B target expression. Patients were divided into 3 categories based on target expression. Low expression (0%–5% targets upregulated; black line; n = 136); moderate expression (5%–10% targets upregulated; gray line; n = 113); or high expression (10%–45% targets upregulated; red line; n = 119). log-rank test P values are shown.

References

    1. Adams MR, Sears R, Nuckolls F, Leone G, Nevins JR. Complex transcriptional regulatory mechanisms control expression of the E2F3 locus. Mol Cell Biol. 2000;20(10):3633–3639. doi: 10.1128/MCB.20.10.3633-3639.2000. - DOI - PMC - PubMed
    1. Leone G, et al. Identification of a novel E2F3 product suggests a mechanism for determining specificity of repression by Rb proteins. Mol Cell Biol. 2000;20(10):3626–3632. doi: 10.1128/MCB.20.10.3626-3632.2000. - DOI - PMC - PubMed
    1. Di Stefano L, Jensen MR, Helin K. E2F7, a novel E2F featuring DP-independent repression of a subset of E2F-regulated genes. EMBO J. 2003;22(23):6289–6298. doi: 10.1093/emboj/cdg613. - DOI - PMC - PubMed
    1. Trikha P, et al. E2f1-3 are critical for myeloid development. J Biol Chem. 2011;286(6):4783–4795. doi: 10.1074/jbc.M110.182733. - DOI - PMC - PubMed
    1. Carr SM, Poppy Roworth A, Chan C, La Thangue NB. Post-translational control of transcription factors: methylation ranks highly. FEBS J. 2015;282(23):4450–4465. doi: 10.1111/febs.13524. - DOI - PubMed