. 2017 Mar 1;127(3):843-856.
doi: 10.1172/JCI88720. Epub 2017 Jan 30.

Regional astrocyte IFN signaling restricts pathogenesis during neurotropic viral infection

Regional astrocyte IFN signaling restricts pathogenesis during neurotropic viral infection

Brian P Daniels et al. J Clin Invest. .

Abstract

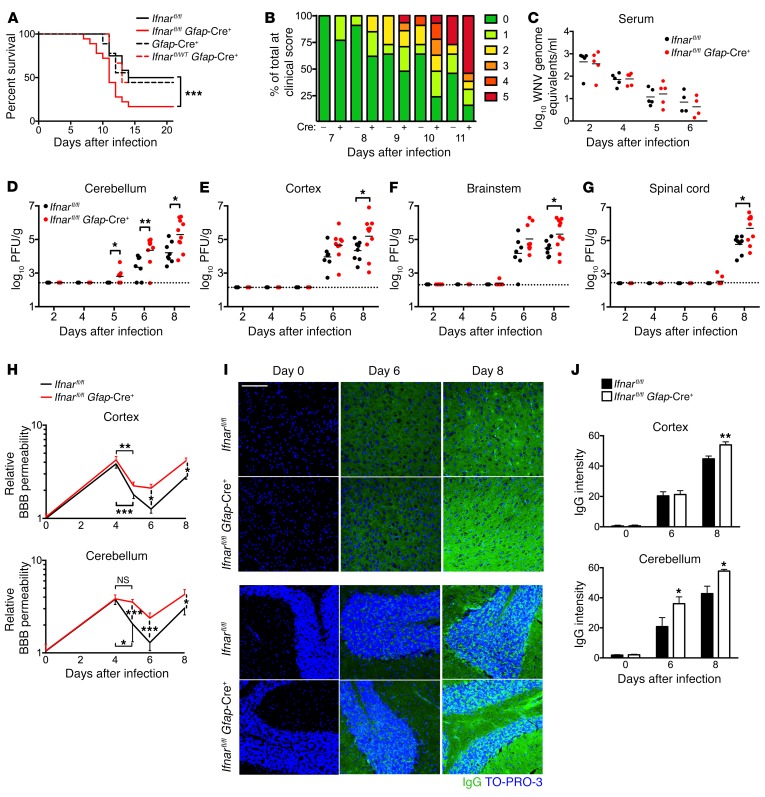
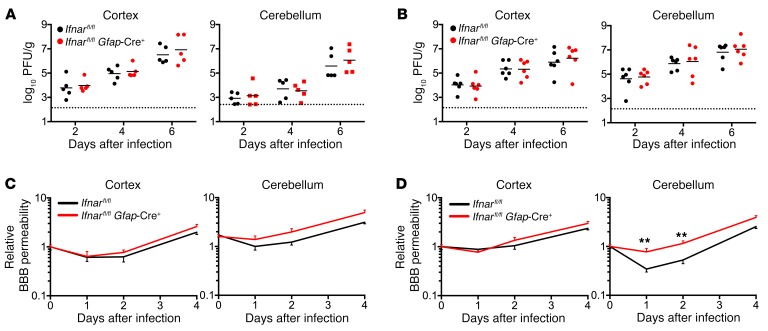
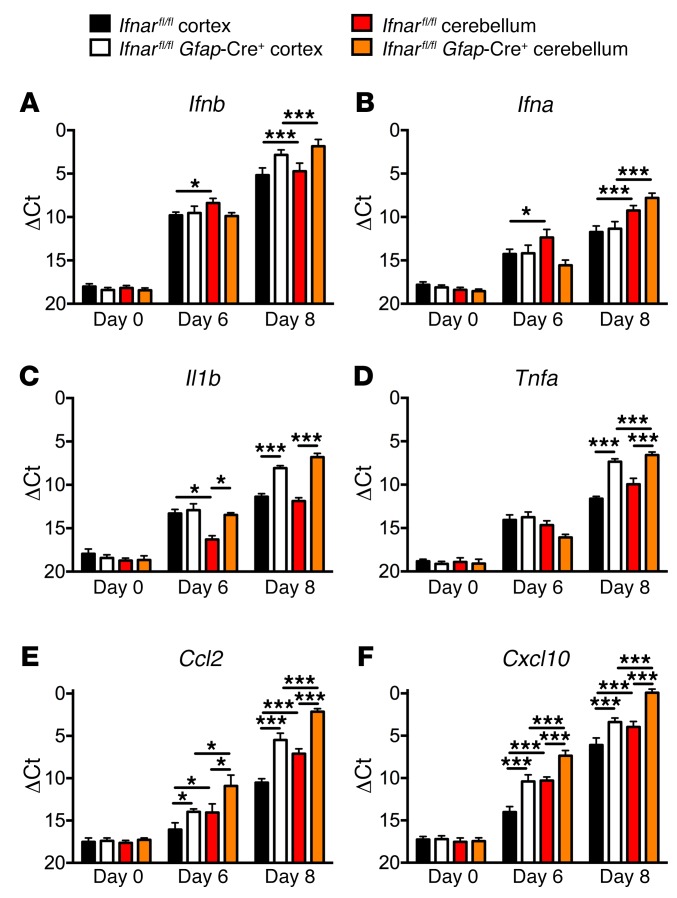
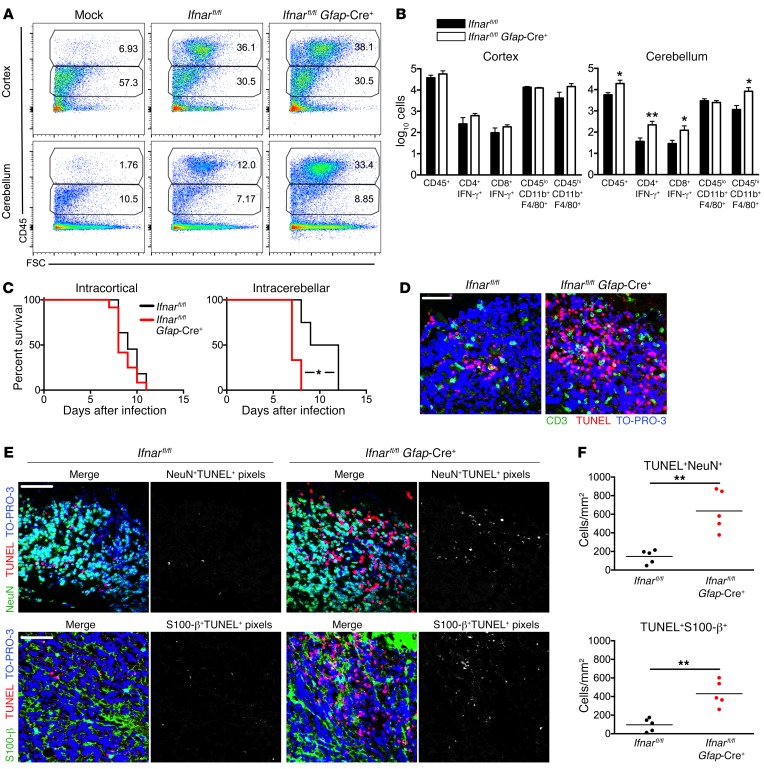
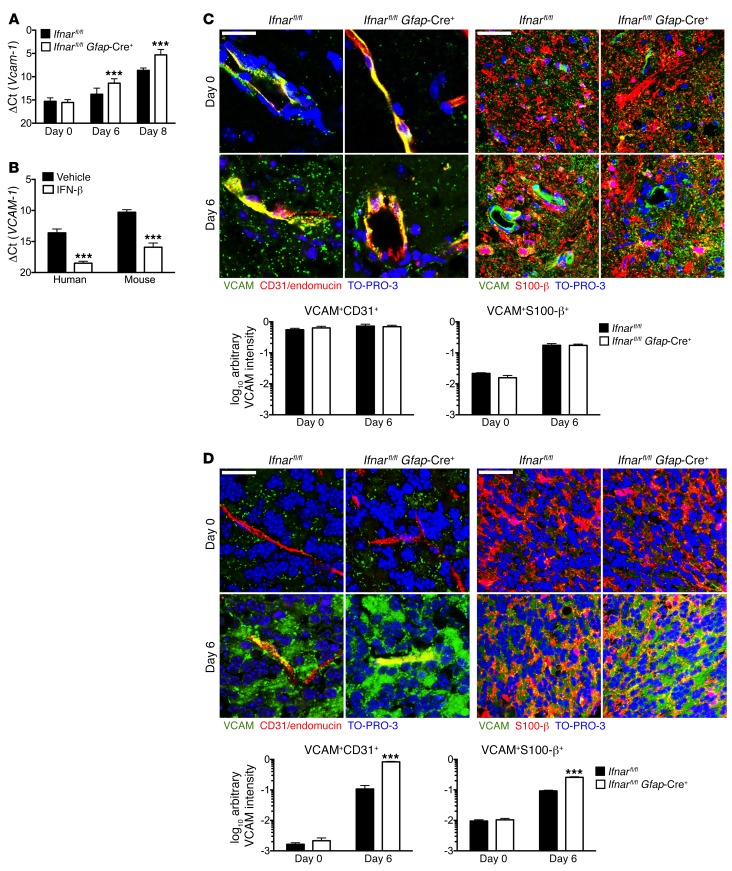
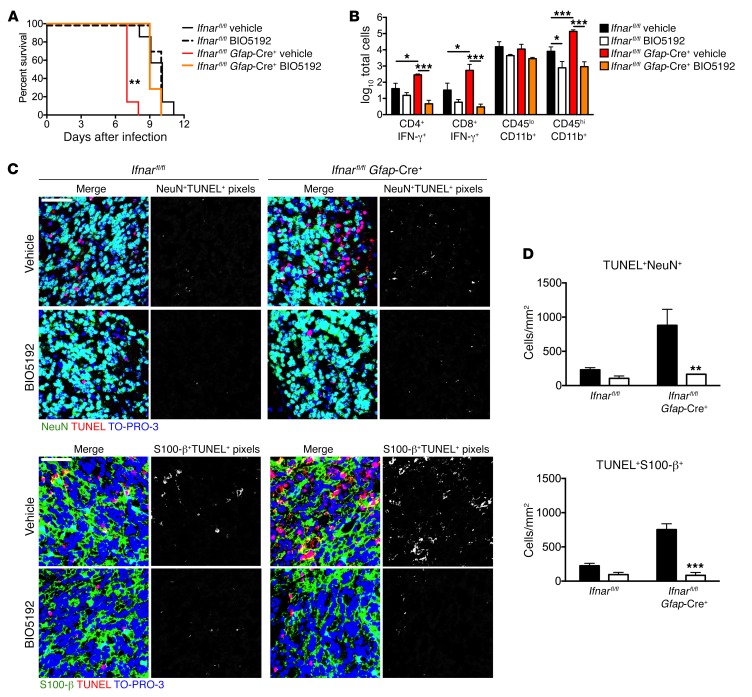
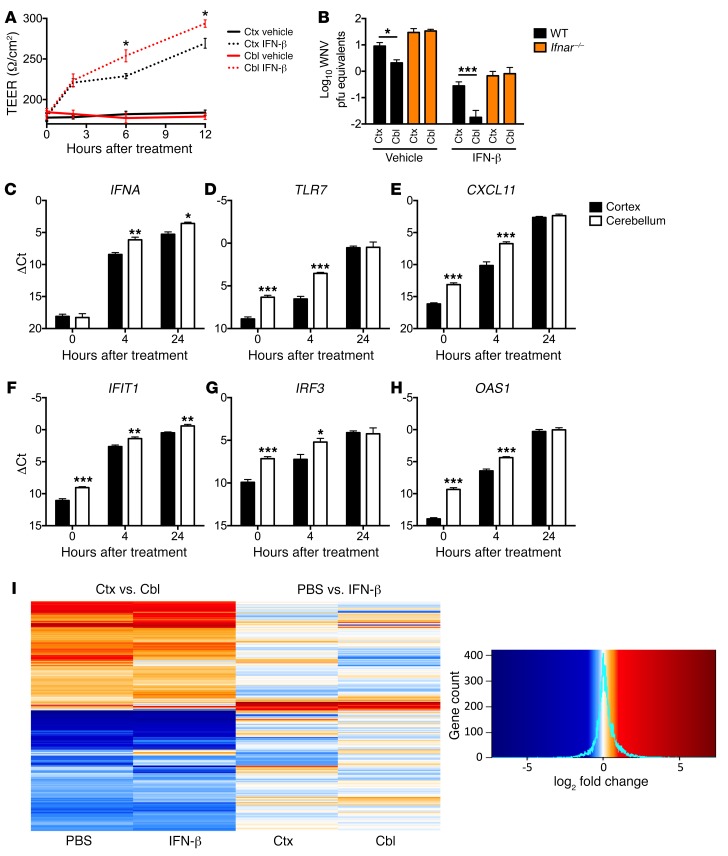
Type I IFNs promote cellular responses to viruses, and IFN receptor (IFNAR) signaling regulates the responses of endothelial cells of the blood-brain barrier (BBB) during neurotropic viral infection. However, the role of astrocytes in innate immune responses of the BBB during viral infection of the CNS remains to be fully elucidated. Here, we have demonstrated that type I IFNAR signaling in astrocytes regulates BBB permeability and protects the cerebellum from infection and immunopathology. Mice with astrocyte-specific loss of IFNAR signaling showed decreased survival after West Nile virus infection. Accelerated mortality was not due to expanded viral tropism or increased replication. Rather, viral entry increased specifically in the hindbrain of IFNAR-deficient mice, suggesting that IFNAR signaling critically regulates BBB permeability in this brain region. Pattern recognition receptors and IFN-stimulated genes had higher basal and IFN-induced expression in human and mouse cerebellar astrocytes than did cerebral cortical astrocytes, suggesting that IFNAR signaling has brain region-specific roles in CNS immune responses. Taken together, our data identify cerebellar astrocytes as key responders to viral infection and highlight the existence of distinct innate immune programs in astrocytes from evolutionarily disparate regions of the CNS.


Conflict of interest statement

Conflict of interest: The authors have declared that no conflict of interest exists.

Figures

Figure 1
Figure 1. Survival and viral burden following s.c. WNV inoculation.
(AI) Mice were inoculated s.c. with WNV (New York 2000 strain). (A) Mice were monitored daily for survival after infection. (B) Clinical scores of Ifnarfl/fl mice either positive or negative for Gfap-Cre (x axis) were recorded on the indicated post-infection days. 0 = subclinical; 1 = hunched/ruffled fur; 2 = altered gate/slow movement; 3 = no movement, but responsive to stimuli; 4 = moribund; 5 = dead. (C) Serum viral loads as measured by qRT-PCR. (DG) Tissue viral loads as measured by plaque assay. (H) BBB permeability was measured by detection of sodium fluorescein accumulation in tissue homogenates derived from cerebral cortex or cerebellum. Data represent the mean ± SEM of individual mouse values normalized to serum sodium fluorescein concentration. Group means were then normalized to the mean values for uninfected controls. (I and J) Immunohistochemical detection of endogenous IgG accumulation in parenchymal CNS tissues. Signal intensities were quantified from two ×40 fields per region using ImageJ software. Scale bar: 100 μm. Data in A and B represent pooled data collected from 3 independent experiments for Ifnarfl/fl Cre (n = 12), Ifnarfl/fl Gfap-Cre+ (n = 17), or Ifnar–/– (n = 8) mice. Data in CG were collected from 2 to 3 independent experiments and represent values recorded for 4 to 10 mice per time point. Data in GI were pooled from a total of 5 mice per time point and were collected from 2 independent experiments. *P < 0.05, **P < 0.01, and ***P < 0.001, by log-rank test (A), Mann-Whitney U test (CG), or 2-way ANOVA (H and J).
Figure 2
Figure 2. CNS replication and BBB permeability following intracranial inoculation.
(AD) Mice were inoculated with WNV (New York 2000 strain) via the intracranial route, and CNS tissues were harvested on the indicated post-infection days. (A and B) Cerebral cortex and cerebellar tissues were collected following intracranial inoculation within the cortex (A, intracortical inoculation) or cerebellum (B, intracerebellar inoculation). WNV titers were determined by standard plaque assay. (C and D) Cerebral cortex and cerebellar tissues were analyzed for accumulation of sodium fluorescein in tissue parenchyma following intracranial inoculation within the cortex (C, intracortical inoculation) or cerebellum (D, intracerebellar inoculation). Data represent the mean ± SEM of individual mouse values normalized to serum fluorescein concentration. Group means were then normalized to mean values for uninfected controls. Data in AD were collected from 2 independent experiments and represent the mean values taken from a total of 5 mice per time point. Data were analyzed by Mann-Whitney U test (A and B) or 2-way ANOVA (C and D). **P < 0.01.
Figure 3
Figure 3. Cytokine and chemokine expression in the CNS following s.c. inoculation.
(AF) Mice were s.c. inoculated with WNV. Cerebral cortex and cerebellar tissues were extracted on the indicated post-infection days. Relative transcript levels in tissue homogenates were measured by SYBR qRT-PCR for the indicated cytokines and chemokines. Data for individual mice were normalized to Gapdh. Data represent the mean ± SEM from a total of 5 to 6 mice and were collected from 2 independent experiments. All data were analyzed by 2-way ANOVA. *P < 0.05 and ***P < 0.001.
Figure 4
Figure 4. CNS immune cell trafficking and immunopathology following intracranial inoculation.
(A and B) Flow cytometric analysis of CNS immune cell infiltrates on day 6 following intracerebellar infection. (A) Representative flow cytometric dot plots demonstrating the percentages of CD45hi versus CD45lo brain leukocytes isolated from the cerebral cortex and cerebellum of mock- and WNV-infected mice. The representative panel for mock infection is for an Ifnarfl/fl mouse, which resembles mock infection in Gfap-Cre+ mice (shown here). The numbers indicate the percentage of each cell type within the total number of cells isolated (after exclusion of doublets and dead cell debris). (B) Total number of CD45+ leukocytes, CD45hiCD4+ and CD45hiCD8+ lymphocytes expressing IFN-γ, and CD45loCD11b+F4/80+ microglia and CD45hiCD11b+F4/80+ macrophages isolated from the indicated brain region. Data in B were collected from 2 independent experiments and represent the mean ± SEM for 6 mice. Note that data in A and B were not normalized for the greater tissue volume of the cerebral cortex versus the cerebellum. (C) Survival was monitored following either intracortical or intracerebellar inoculation. Survival data for 10 to 11 mice per group were pooled from 2 independent infections. (D and E) Immunohistochemical detection of TUNEL+ nuclei of dead and dying cells in the cerebellar granule cell layer, costained for CD3+ T lymphocytes (D), NeuN+ neurons (E), or S100-β+ astrocytes (E). Scale bars: 50 μm. (F) Quantification of dead and dying neurons (TUNEL+NeuN+) or astrocytes (TUNEL+S100-β+), generated by counting cells that were double positive for TUNEL and the appropriate cell marker (depicted in pixel-masked images to the right of the merged RGB images in E). Data were determined by counting 4 images from 2 nonserial sections per mouse (n = 5 mice/group). Counts for each image were normalized to the total area of the granule cell layer present per high-power field. Graphed data points represent averages for all images taken for individual mice. All data represent pooled values from 2 independent experiments and were compared using an unpaired, 2-tailed Student’s t test (B and F) or log-rank test (C). *P < 0.05 and **P < 0.01. All error bars are SEM.
Figure 5
Figure 5. VCAM-1 expression in cerebellar astrocytes in vitro and in the CNS in vivo following infection.
(A and B) Vcam-1 mRNA levels were detected by SYBR qRT-PCR. (A) Vcam-1 mRNA levels were detected in the cerebella of mice taken on the indicated days following s.c. infection. (B) VCAM-1 mRNA levels in primary adult human cerebellar astrocytes and primary murine neonatal cerebellar astrocytes following a 4-hour treatment with 10 U/ml IFN-β. Ct values in A and B were normalized to the Ct values of the housekeeping gene Gapdh. (C and D) Immunohistochemical detection of VCAM-1 expression on CD31/endomucin+ (cocktail+) endothelial cells and S100-β+ astrocytes in the cerebral cortex (C) or cerebellum (D). Scale bars: 50 μm. VCAM-1 expression on the indicated cell type was quantified as the mean VCAM-1 (green) fluorescence intensity of pixels that stained positive for the indicated cell marker. Data were obtained after quantifying 4 images from 2 randomly chosen, nonserial sections per mouse (81,000 μm2 total analyzed area per mouse, 5 mice per group). Data are reported as log10 arbitrary fluorescence intensity units. Data in AD are from 2 independent experiments and are representative images or the mean ± SEM of 5 to 6 replicates per mouse per group. ***P < 0.001, by 2-way ANOVA.
Figure 6
Figure 6. Survival, immune infiltrates, and immunopathology following pharmacological blockade of VLA-4.
(AD) Mice were inoculated via an intracerebellar route with WNV. Infected mice in all experiments were treated i.p. with 10 mg/kg BIO5192, a small-molecule VLA-4 antagonist, or vehicle solution beginning on day 4 after infection. (A) Survival was monitored daily following infection (n = 7 mice/group). (B) Flow cytometric analysis of immune infiltrates in the cerebellum on day 6 after infection (n = 4 mice/group) (C) Immunohistochemical detection of TUNEL+ neurons (NeuN, left) and astrocytes (S100-β, right) in cerebellar granule cell layers of infected mice on day 6 after infection. Scale bar: 50 μm. (D) Quantification of dead and dying neurons (left panel) or astrocytes (right panel), generated by counting cells double positive for TUNEL and the appropriate cell marker (depicted in pixel masked images to the right of merged RGB images). Data are taken from counting 4 images from 2 nonserial sections per mouse (5 mice/group). Counts for each image were normalized to the total area of granule cell layer present per high-power field. All data represent pooled values from 2 independent experiments. *P < 0.05 , **P < 0.01, and ***P < 0.001, by log-rank test (A) or 2-way ANOVA (B and D).
Figure 7
Figure 7. Type I IFN responses in astrocytes in vitro.
(A and B) In vitro BBB Transwell cultures were generated with either cerebral cortical or cerebellar astrocytes. (A) TEER recordings in cultures treated with saline vehicle or 10 U/ml recombinant IFN-β. (B) Cultures were generated with cerebral cortical or cerebellar astrocytes (x axis) derived from either WT (black bars) or Ifnar–/– mice (orange bars) and treated overnight with either saline vehicle or 10 U/ml recombinant IFN-β. Following pretreatment, WNV (0.01 MOI) was added to the top chamber of cultures and allowed to migrate for 6 hours. Data represent combined WNV genome copy numbers detected in the astrocyte monolayer and bottom chamber supernatant. (CH) Primary human cerebral cortical or cerebellar astrocytes were treated with 10 U/ml recombinant IFN-β and analyzed for transcript expression of the indicated genes 4 and 24 hours after treatment. Ct values for all genes were normalized to Ct values of the housekeeping gene GAPDH. (I) Primary human cerebral cortical or cerebellar astrocytes were treated for 4 hours with PBS or 10U/ml recombinant IFN-β and subjected to RNA-seq. Heatmap and histogram of global gene expression across regions and treatment groups were generated from all statistically significant genes. Data in AH represent the mean ± SEM of 5 to 6 replicates from 2 to 3 independent experiments and were analyzed by 2-way ANOVA. Data in I were derived from 3 independent samples per group and were analyzed as described in the Methods. *P < 0.05 , **P < 0.01, and ***P < 0.001. Cbl, cerebellum; Ctx, cortex.

Similar articles

Cited by

References

    1. Platanias LC. Mechanisms of type-I- and type-II-interferon-mediated signalling. Nat Rev Immunol. 2005;5(5):375–386. doi: 10.1038/nri1604. - DOI - PubMed
    1. Lazear HM, Diamond MS. New insights into innate immune restriction of West Nile virus infection. Curr Opin Virol. 2015;11:1–6. doi: 10.1016/j.coviro.2014.12.001. - DOI - PMC - PubMed
    1. Schoggins JW, Rice CM. Interferon-stimulated genes and their antiviral effector functions. Curr Opin Virol. 2011;1(6):519–525. doi: 10.1016/j.coviro.2011.10.008. - DOI - PMC - PubMed
    1. Daniels BP, Holman DW, Cruz-Orengo L, Jujjavarapu H, Durrant DM, Klein RS. Viral pathogen-associated molecular patterns regulate blood-brain barrier integrity via competing innate cytokine signals. MBio. 2014;5(5):e01476–e01414. - PMC - PubMed
    1. Persidsky Y, Ramirez SH, Haorah J, Kanmogne GD. Blood-brain barrier: structural components and function under physiologic and pathologic conditions. J Neuroimmune Pharmacol. 2006;1(3):223–236. doi: 10.1007/s11481-006-9025-3. - DOI - PubMed

MeSH terms

Substances