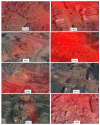
Earthquake Damage Visualization (EDV) Technique for the Rapid Detection of Earthquake-Induced Damages Using SAR Data
- PMID: 28134796
- PMCID: PMC5336022
- DOI: 10.3390/s17020235
Earthquake Damage Visualization (EDV) Technique for the Rapid Detection of Earthquake-Induced Damages Using SAR Data
Abstract
The damage of buildings and manmade structures, where most of human activities occur, is the major cause of casualties of from earthquakes. In this paper, an improved technique, Earthquake Damage Visualization (EDV) is presented for the rapid detection of earthquake damage using the Synthetic Aperture Radar (SAR) data. The EDV is based on the pre-seismic and co-seismic coherence change method. The normalized difference between the pre-seismic and co-seismic coherences, and vice versa, are used to calculate the forward (from pre-seismic to co-seismic) and backward (from co-seismic to pre-seismic) change parameters, respectively. The backward change parameter is added to visualize the retrospective changes caused by factors other than the earthquake. The third change-free parameter uses the average values of the pre-seismic and co-seismic coherence maps. These three change parameters were ultimately merged into the EDV as an RGB (Red, Green, and Blue) composite imagery. The EDV could visualize the earthquake damage efficiently using Horizontal transmit and Horizontal receive (HH), and Horizontal transmit and Vertical receive (HV) polarizations data from the Advanced Land Observing Satellite-2 (ALOS-2). Its performance was evaluated in the Kathmandu Valley, which was hit severely by the 2015 Nepal Earthquake. The cross-validation results showed that the EDV is more sensitive to the damaged buildings than the existing method. The EDV could be used for building damage detection in other earthquakes as well.
Keywords: 2015 Nepal Earthquake; ALOS-2; EDV; SAR; buildings; coherence; cross-validation; earthquake damage; visualization.
Conflict of interest statement
The authors declare that there is no conflict of interest.
Figures


References
-
- Dong L., Shan J. A comprehensive review of earthquake-induced building damage detection with remote sensing techniques. ISPRS J. Photogramm. Remote Sens. 2013;84:85–99. doi: 10.1016/j.isprsjprs.2013.06.011. - DOI
-
- Matsuoka M., Yamazaki F. Use of Satellite SAR Intensity Imagery for Detecting Building Areas Damaged Due to Earthquakes. Earthq. Spectra. 2004;20:975–994. doi: 10.1193/1.1774182. - DOI
-
- Turker M., San B.T. SPOT HRV data analysis for detecting earthquake-induced changes in Izmit, Turkey. Int. J. Remote Sens. 2003;24:2439–2450. doi: 10.1080/0143116031000070427. - DOI
-
- Yusuf Y., Matsuoka M., Yamazaki F. Damage assessment after 2001 Gujarat earthquake using Landsat-7 satellite images. J. Indian Soc. Remote Sens. 2001;29:17–22. doi: 10.1007/BF02989909. - DOI
-
- Saito K., Spence R.J.S., Going C., Markus M. Using High-Resolution Satellite Images for Post-Earthquake Building Damage Assessment: A Study Following the 26 January 2001 Gujarat Earthquake. Earthq. Spectra. 2004;20:145–169. doi: 10.1193/1.1650865. - DOI
LinkOut - more resources
Full Text Sources
Other Literature Sources
Miscellaneous

