. 2017 Mar;23(3):386-395.
doi: 10.1038/nm.4273. Epub 2017 Jan 30.

DNA methylation heterogeneity defines a disease spectrum in Ewing sarcoma

Affiliations

DNA methylation heterogeneity defines a disease spectrum in Ewing sarcoma

Nathan C Sheffield et al. Nat Med. 2017 Mar.

Abstract

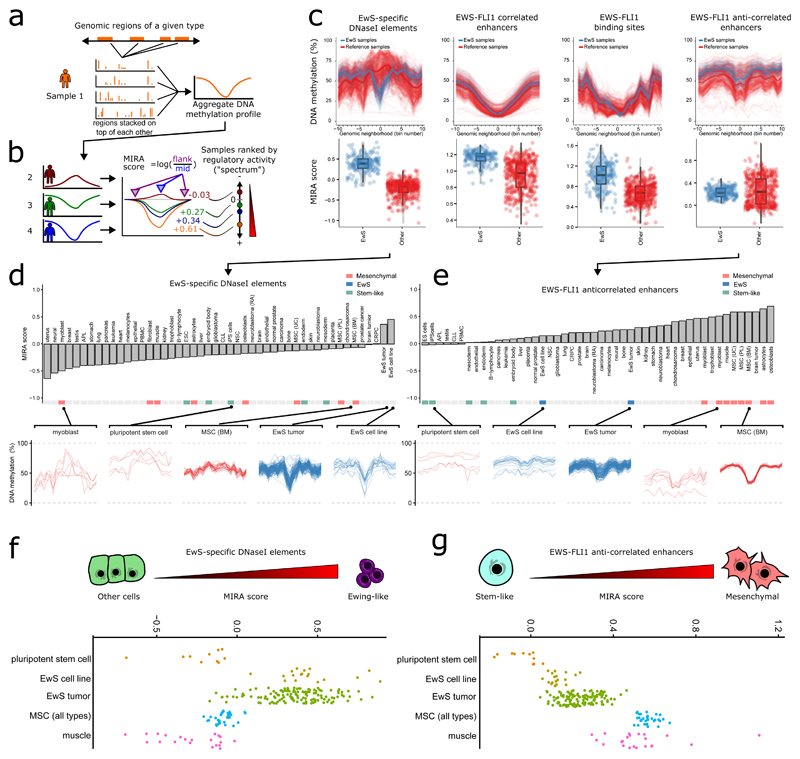
Developmental tumors in children and young adults carry few genetic alterations, yet they have diverse clinical presentation. Focusing on Ewing sarcoma, we sought to establish the prevalence and characteristics of epigenetic heterogeneity in genetically homogeneous cancers. We performed genome-scale DNA methylation sequencing for a large cohort of Ewing sarcoma tumors and analyzed epigenetic heterogeneity on three levels: between cancers, between tumors, and within tumors. We observed consistent DNA hypomethylation at enhancers regulated by the disease-defining EWS-FLI1 fusion protein, thus establishing epigenomic enhancer reprogramming as a ubiquitous and characteristic feature of Ewing sarcoma. DNA methylation differences between tumors identified a continuous disease spectrum underlying Ewing sarcoma, which reflected the strength of an EWS-FLI1 regulatory signature and a continuum between mesenchymal and stem cell signatures. There was substantial epigenetic heterogeneity within tumors, particularly in patients with metastatic disease. In summary, our study provides a comprehensive assessment of epigenetic heterogeneity in Ewing sarcoma and thereby highlights the importance of considering nongenetic aspects of tumor heterogeneity in the context of cancer biology and personalized medicine.


Conflict of interest statement

Competing financial interests

The authors declare no competing financial interests.

Figures

Figure 1
Figure 1. DNA methylation profiling reveals a characteristic epigenomic signature of Ewing sarcoma.
(a) Epigenetic heterogeneity in Ewing sarcoma (EwS) analyzed at three levels: between cancer types (inter-cancer), between EwS tumors (inter-individual), and within EwS tumors (intratumor). (b) Multidimensional scaling plot showing this study’s RRBS profiles, which includes EwS tumors, EwS cell lines, and mesenchymal stem cells (MSCs) derived from bone marrow (BM), umbilical cord (UC), and placenta (PL), in the context of published RRBS profiles for other cancers (Supplementary Table 2). DNA methylation levels were averaged across 5-kb tiling regions. APL, acute promyelocytic leukemia; CHS, chondrosarcoma; CLL, chronic lymphocytic leukemia; CRPC, castration-resistant prostate cancer. (c) Multidimensional scaling plot as shown in b, but focusing specifically on EwS tumors, EwS cell lines, and MSCs. (d) DNA methylation heat map for CpGs with lower DNA methylation levels in EwS tumors as compared to reference profiles for other cancers and for a diverse set of other cell types (Supplementary Table 2). Bar plots indicate significant overlap of EwS-specific hypomethylated regions with public annotation data, based on LOLA analysis (Supplementary Table 3). (e) As in d, but focusing on CpGs with higher DNA methylation levels in EwS tumors as compared to the reference profiles. (f) Example of EwS-specific hypomethylation at the CCND1 locus, with substantially lower DNA methylation (and anti-correlated histone H3K27 acetylation) in EwS tumors and EwS cell lines as compared to all reference samples. DNA methylation levels are shown for 50 bins spanning the locus (yellow, high methylation; blue, low methylation; white, no data). H3K27ac profiles include a cross-tissue consensus track from the ENCODE project, as well as ChIP-seq data for an EwS cell line (A673sh) with inducible knock-down of EWS-FLI1 (EWS-FLI1 high/low) and this study’s data for three EwS tumors (tumors 119, 120, and 121). (g) As in f, but focusing on EwS-specific hypermethylation of a putative regulatory region at the GATA2 locus.
Figure 2
Figure 2. DNA methylation in EwS shows inter-individual heterogeneity without distinct subtypes.
(a) Bar plot showing the coefficient of variation across samples for median DNA methylation levels per sample as a measure of heterogeneity between samples. The coefficient of variation was calculated separately for EwS cell lines, EwS tumors, and MSCs derived from bone marrow (BM), umbilical cord (UC) and placenta (PL) from this study, and for reference profiles of other cancers. APL, acute promyelocytic leukemia; CHS, chondrosarcoma; CLL, chronic lymphocytic leukemia; CRPC, castration-resistant prostate cancer. (b) DNA methylation profiles for four types of EwS-linked regulatory regions: (i) EwS-specific DNaseI elements based on DNase-seq in the SK-N-MC cell line; (ii) EWS-FLI1 binding sites based on ChIP-seq for EWS-FLI1 in the A673sh cell line; (iii) EWS-FLI1-correlated enhancers based on decreased H3K27ac ChIP-seq signal upon EWS-FLI1 knockdown in A673sh; and (iv) EWS-FLI1-anti-correlated enhancers based on increased H3K27ac ChIP-seq signal upon EWS-FLI1 knockdown in A673sh. 50 randomly selected regions are shown to illustrate DNA methylation variability between tumors (see Supplementary Fig. 4b for all data). (c) Example of epigenetic heterogeneity at one EWS-FLI1-correlated enhancer showing opposing trends in DNA methylation versus H3K27ac among three EwS tumors (119, 120, and 121). Black vertical lines represent CpG sites, with the height indicating their DNA methylation levels. (d) As in c, but focusing on epigenetic heterogeneity at one EWS-FLI1-anti-correlated enhancer. (e) EwS tumor grouping using five alternative methods for sample clustering and unsupervised subtype identification, showing no evidence of epigenetically defined disease subtypes in EwS.
Figure 3
Figure 3. DNA methylation at regulatory elements defines an epigenetic disease spectrum underlying EwS.
(a,b) Conceptual outline of the ‘methylation-based inference of regulatory activity’ (MIRA) score. (a) First, all genomic regions of a given annotation type (such as EwS-specific DNaseI elements) are superimposed and their aggregate DNA methylation profiles derived. (b) Next, the MIRA score of a given region type in a given sample is calculated as the logarithm of the ratio between the mean DNA methylation level at the aggregate DNA methylation profile’s flanking regions versus the corresponding value at the region’s center. High MIRA scores correspond to a strong dip in DNA methylation and high inferred regulatory activity, whereas MIRA scores close to zero correspond to flat DNA methylation profiles and little potential for regulatory activity. (c) Aggregate DNA methylation profiles for four types of EwS-linked regulatory regions: EwS-specific DNaseI elements, EWS-FLI1-correlated enhancers, EWS-FLI1 binding sites, and EWS-FLI1-anti-correlated enhancers. Each line corresponds to the aggregate DNA methylation profile of an EwS sample (blue) or non-EwS reference sample (red). Box plots show MIRA scores for the corresponding region sets (boxes represent median and quartiles, and whiskers extend from the box to the most extreme point located within 1.5 times the inter-quartile range). (d) Bar plot for samples grouped by cell type and ordered according to the mean MIRA score for EwS-specific DNaseI elements. Aggregate DNA methylation profiles for myoblasts, pluripotent stem cells, and MSCs are shown to illustrate low regulatory activity in these regions, whereas high MIRA scores for EwS tumors and EwS cell lines indicate high regulatory activity. (e) As in d, but focusing on MIRA scores for EWS-FLI1-anti-correlated enhancers. (f) Distribution of MIRA scores for EWS-specific DNaseI elements, which places the EwS tumors on an epigenetic disease spectrum with different levels of “Ewing-ness”. (g) Distribution of MIRA scores for EWS-FLI1-anti-correlated enhancers, which places the EwS tumors on an epigenetic disease spectrum that is linked to a stem-like regulatory signature on the one end and a mesenchymal regulatory signature on the other end.
Figure 4
Figure 4. DNA methylation patterns identify widespread intra-tumor heterogeneity in EwS.
(a) Distribution of sample-specific PDR scores of EwS tumors, EwS cell lines, and MSCs derived from bone marrow (BM), umbilical cord (UC), and placenta (PL) from this study, as compared to reference profiles for other cancers. APL, acute promyelocytic leukemia; CHS, chondrosarcoma; CLL, chronic lymphocytic leukemia; CRPC, castration-resistant prostate cancer (boxes represent median and quartiles, and whiskers extend from the box to the most extreme point located within 1.5 times the inter-quartile range). (b) Conceptual outline of the PIM score, which measures the proportion of CpG sites with intermediate DNA methylation levels. Higher PIM scores indicate higher levels of intra-tumor heterogeneity. (c) As in a, but focusing on sample-specific relative PIM scores. (d) Density scatterplot (left) showing the relationship between PDR and PIM scores for 5-kb tiling regions, including only regions with more than 25 CpG dinucleotides. The two scores are correlated (r = 0.76), but there are also many regions with divergent scores, which is illustrated by two conceptual examples (right).
Figure 5
Figure 5. DNA methylation heterogeneity in EwS is associated with genetic and clinical data.
(a) Heat map illustrating the association between measures of epigenetic heterogeneity and genetic, as well as clinical annotations among the EwS tumors. Brighter colors indicate higher significance according to the Wilcoxon rank-sum test. (b) Violin plot comparing the MIRA score at EWS-FLI1-anti-correlated enhancers (which corresponds to the mesenchymal versus stem-like dimension of the disease spectrum) for EwS tumors with or without mutations in STAG2 (boxes represent median and quartiles, and whiskers extend from the box to the most extreme point located within 1.5 times the inter-quartile range). (c) Violin plot comparing the MIRA score at EwS-specific DNaseI elements (which corresponds to the Ewing-like dimension of the disease spectrum) for EwS tumors with or without mutations in TP53. (d) Violin plot comparing the PIM score between primary EwS tumors of patients whose disease was metastatic at diagnosis versus patients with localized disease. (e) Receiver operating characteristic (ROC) curve and area under curve (AUC) value for predicting whether a patient was metastatic at diagnosis on the basis of the PIM score. Inset, distribution of AUC values and the resulting P value according to permutation testing with randomly shuffled labels.

References

    1. de Álava E, Lessnick SL, Sorensen PHB. Ewing sarcoma. In: Fletcher CDM, Bridge JA, Hogendoorn PCW, Mertens F, editors. WHO Classification of tumours of soft tissue and bone. 2013. pp. 306–309.
    1. Delattre O, et al. Gene fusion with an ETS DNA-binding domain caused by chromosome translocation in human tumours. Nature. 1992;359:162–165. doi: 10.1038/359162a0. - DOI - PubMed
    1. Parham DM, et al. Neuroectodermal differentiation in Ewing’s sarcoma family of tumors does not predict tumor behavior. Hum Pathol. 1999;30:911–918. doi: 10.1016/S0046-8177(99)90244-7. - DOI - PubMed
    1. Pinto A, Dickman P, Parham D. Pathobiologic markers of the ewing sarcoma family of tumors: state of the art and prediction of behaviour. Sarcoma. 2011;2011 doi: 10.1155/2011/856190. 856190. - DOI - PMC - PubMed
    1. Schmidt D, Herrmann C, Jürgens H, Harms D. Malignant peripheral neuroectodermal tumor and its necessary distinction from Ewing’s sarcoma. A report from the Kiel Pediatric Tumor Registry. Cancer. 1991;68:2251–2259. doi: 10.1002/1097-0142(19911115)68:10%3c2251::AID-CNCR2820681025%3e3.0.CO;2-X. - DOI - PubMed

MeSH terms

Substances