

doi: 10.1038/nn.4492.
Epub 2017 Jan 30.
[18F]FDG PET signal is driven by astroglial glutamate transport
Affiliations
- PMID: 28135241
- PMCID: PMC5378483
- DOI: 10.1038/nn.4492
Item in Clipboard
[18F]FDG PET signal is driven by astroglial glutamate transport
Nat Neurosci.
2017 Mar.
Abstract
Contributions of glial cells to neuroenergetics have been the focus of extensive debate. Here we provide positron emission tomography evidence that activation of astrocytic glutamate transport via the excitatory amino acid transporter GLT-1 triggers widespread but graded glucose uptake in the rodent brain. Our results highlight the need for a reevaluation of the interpretation of [18F]FDG positron emission tomography data, whereby astrocytes would be recognized as contributing to the [18F]FDG signal.
Conflict of interest statement
The authors declare no conflict of interest.
The authors declare no competing financial interests.
Figures
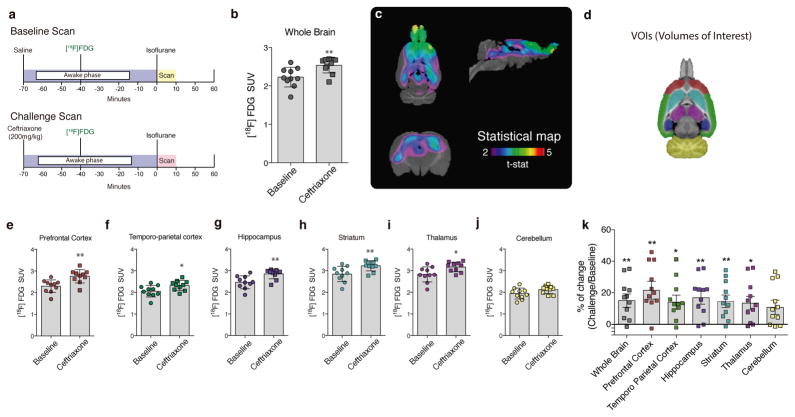
(a) Study design: rats received a tail vein injection of saline or CEF (200 mg/kg) 70 minutes before the scan. Thirty minutes later they received an [18F]FDG tail vein injection and were allowed to freely move in their cages (awake) during a 40 minutes uptake phase. After that period, a static scan of 10 minutes was acquired. (b) Whole brain [18F]FDG uptake. (c) Statistical parametric images (t-statistical map (CEF challenge > baseline) overlaid on a histological template. (d) Brain mask showing volume of interest (VOIs) overlaid on a histological template. Regional [18F]FDG uptake in the prefrontal (e) and temporo-parietal cortices (f), hippocampus (g), striatum (h), thalamus (i) and cerebellum (j). Regional percentage of change in VOIs (challenge > baseline, k). n = 10 rats per group. *p < 0.05, and **p < 0.01. Two tailed paired t-test. Data are presented as mean values ± s.d. and individual scatter plots. Note that each region has a correspondent scatter plot color, which follows regions defined in the VOIs mask; prefrontal cortex (red), temporo-parietal cortex (green), hippocampus (dark-purple), striatum (light-green), thalamus (light-purple) and cerebellum (yellow).
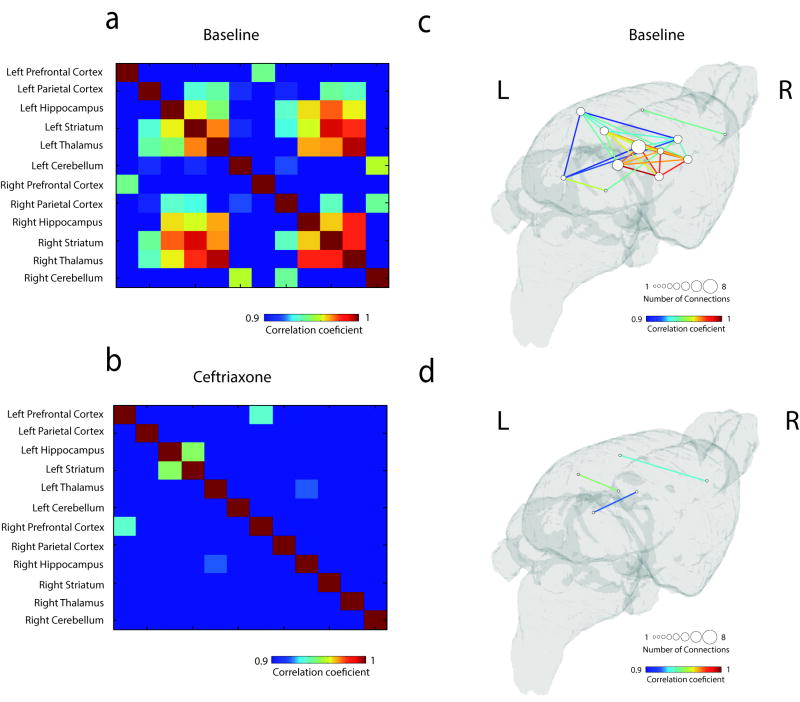
Cross-correlation matrices: inter-subject cross-correlation maps displaying region-to-region associations in the baseline (a) and CEF challenge (b) conditions. Metabolic networks: 3D brain surfaces displaying large-scale metabolic cross-correlation maps in the baseline (c) and in the CEF challenge (d) conditions. n = 10 rats per group. Data presented as correlation values with Bonferonni corrected threshold, p < 0.05.
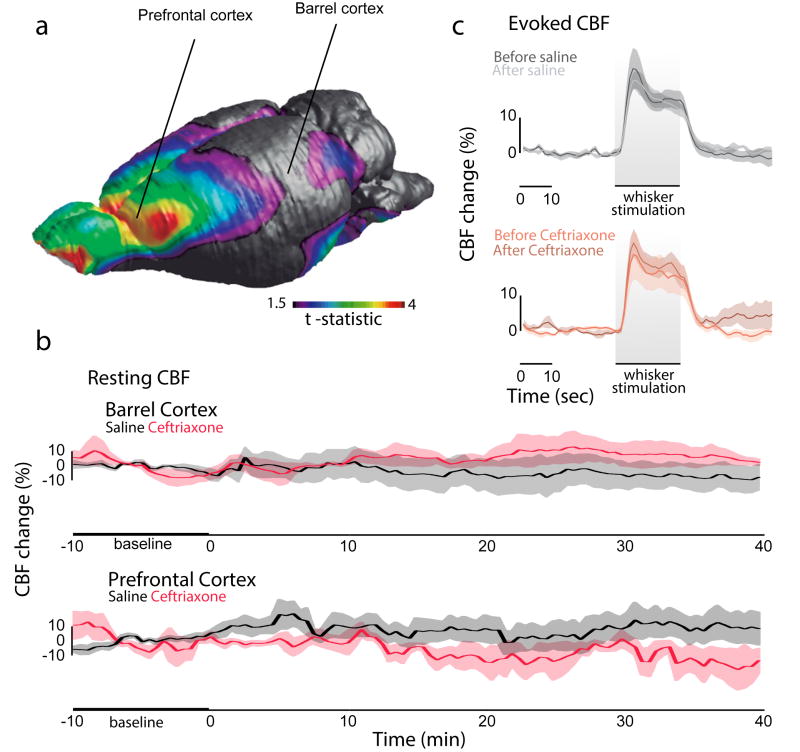
(a) 3D brain surface displaying highest effects of CEF challenge and probe locations. (b) Temporal resting CBF flow analysis during baseline and after injection of saline or CEF in the barrel (repeated measure one-way ANOVA, p = 0.2714) and prefrontal cortices (repeated measure one-way ANOVA, p = 0.6495). (c) Evoked CBF analysis in the barrel cortex (repeated measure two-way ANOVA, interaction: p > 0.999; whiskers stimulation effect: p < 0.001; group effect: p = 0.6170). n= 5 per group for evoked CBF; n = 5 per group for resting CBF in the PFC; and n = 4 per group for resting CBF in the barrel cortex. Data are presented as mean values ± s.e.m (shadows).
Comment in
-
Glucose utilization: still in the synapse.Nat Neurosci. 2017 Feb 23;20(3):382-384. doi: 10.1038/nn.4513. Nat Neurosci. 2017. PMID: 28230843 No abstract available.
References
MeSH terms
Substances
Grants and funding
LinkOut - more resources
Full Text Sources
Other Literature Sources
