. 2017 Mar;20(3):449-458.
doi: 10.1038/nn.4487. Epub 2017 Jan 30.

Hormonal gain control of a medial preoptic area social reward circuit

Affiliations

Hormonal gain control of a medial preoptic area social reward circuit

Jenna A McHenry et al. Nat Neurosci. 2017 Mar.

Erratum in

Abstract

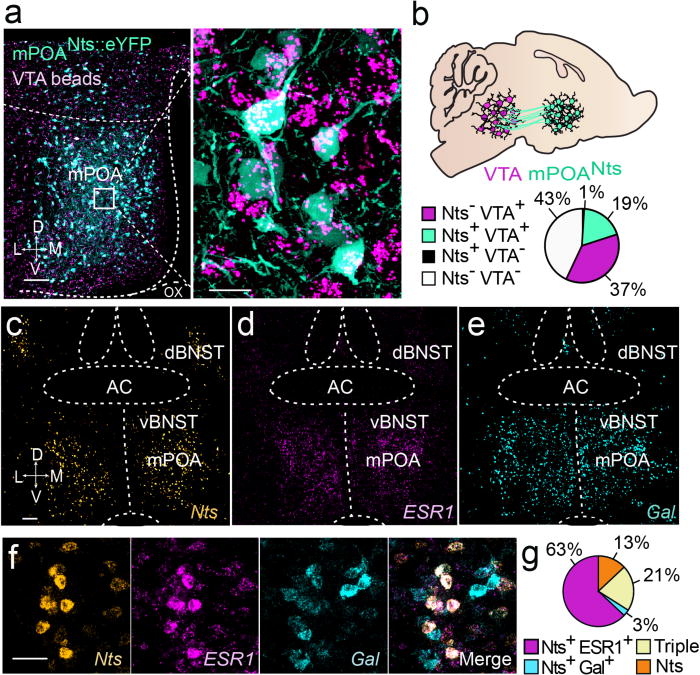
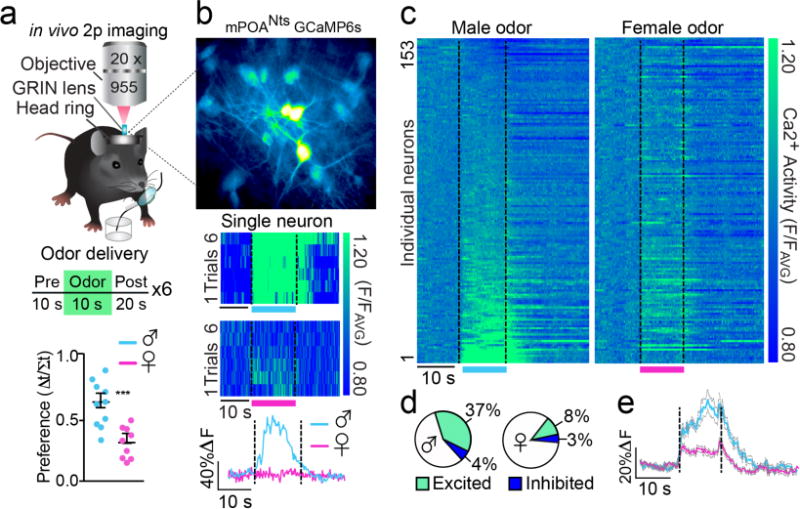
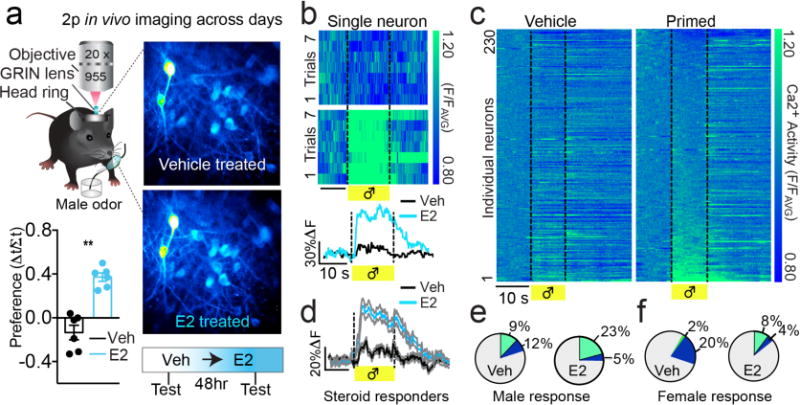
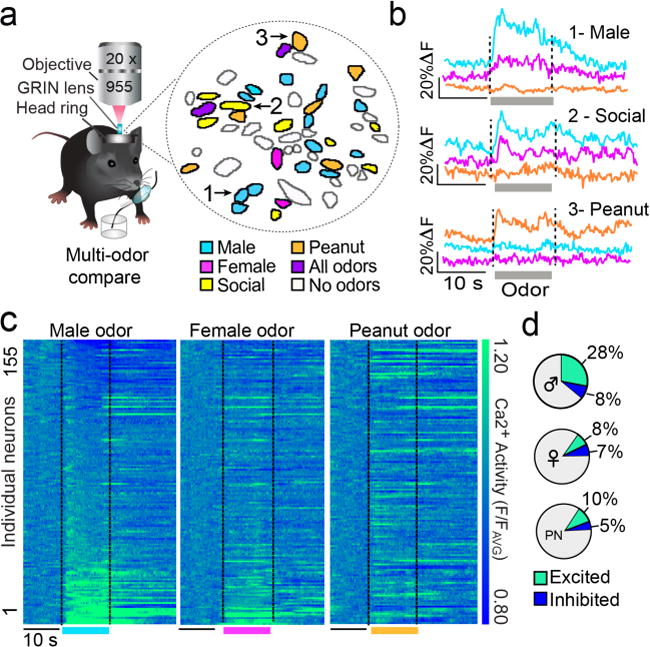
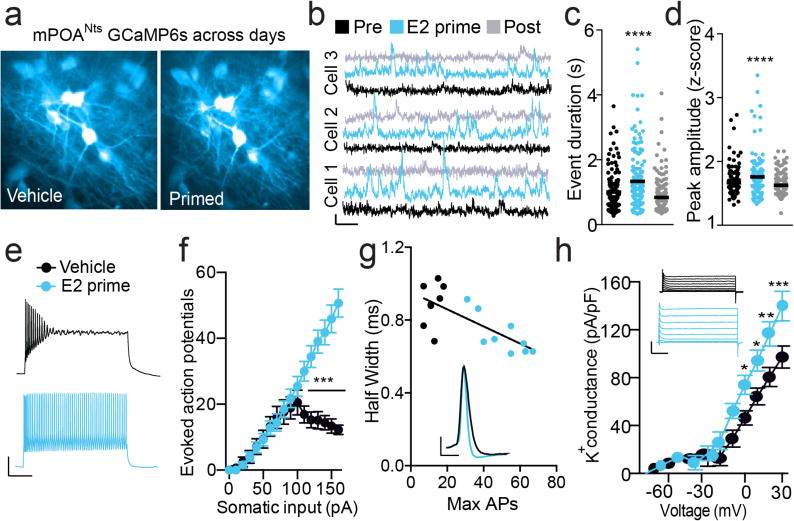
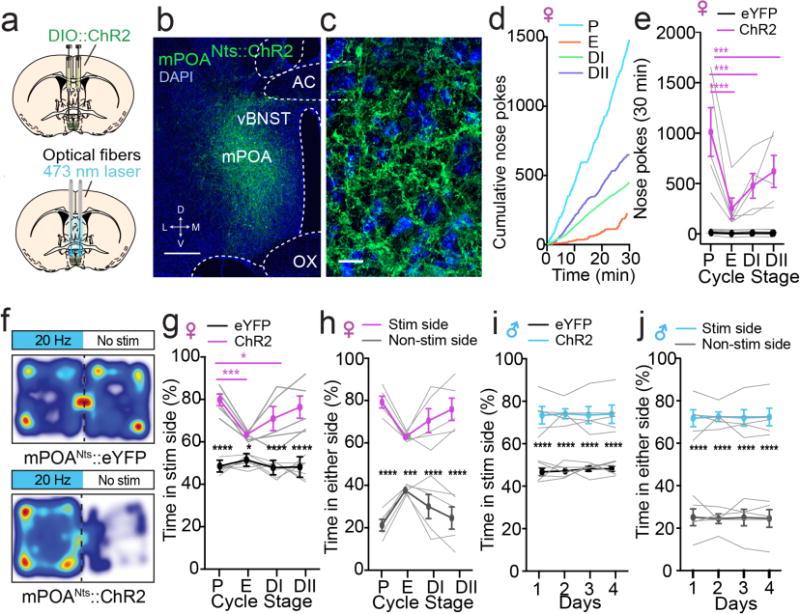
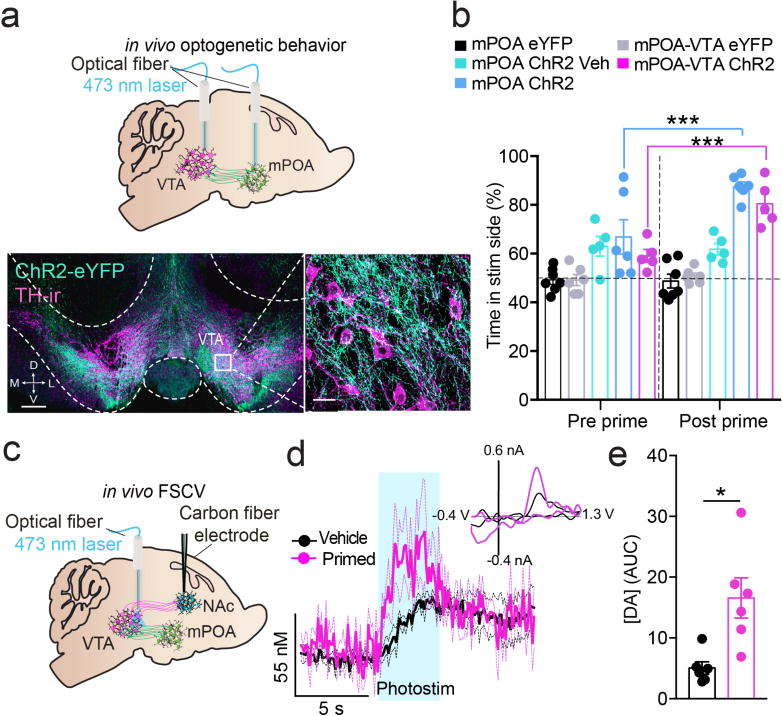
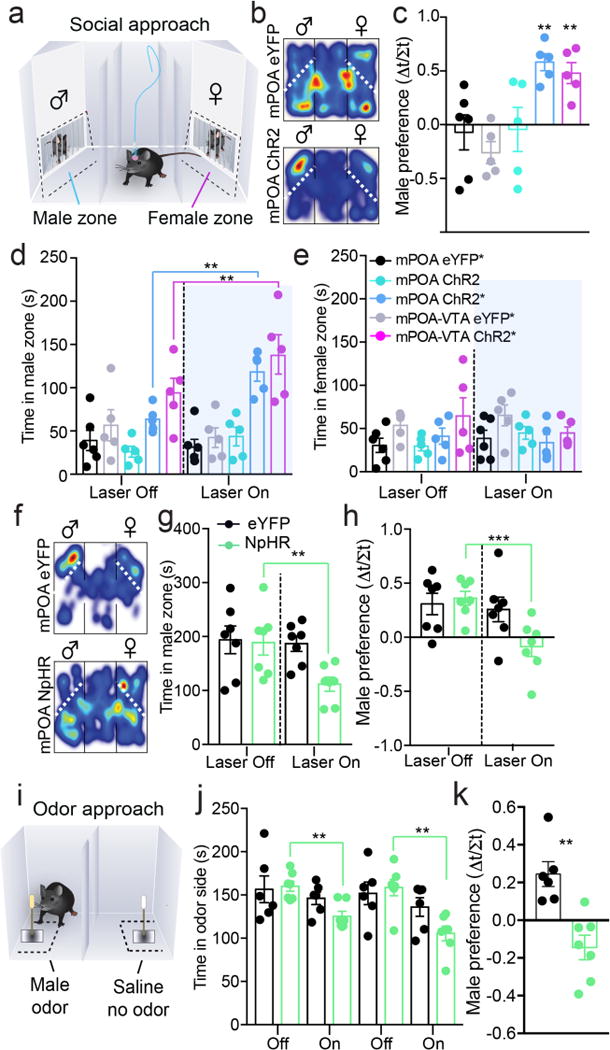
Neural networks that control reproduction must integrate social and hormonal signals, tune motivation, and coordinate social interactions. However, the neural circuit mechanisms for these processes remain unresolved. The medial preoptic area (mPOA), an essential node for social behaviors, comprises molecularly diverse neurons with widespread projections. Here we identify a steroid-responsive subset of neurotensin (Nts)-expressing mPOA neurons that interface with the ventral tegmental area (VTA) to form a socially engaged reward circuit. Using in vivo two-photon imaging in female mice, we show that mPOANts neurons preferentially encode attractive male cues compared to nonsocial appetitive stimuli. Ovarian hormone signals regulate both the physiological and cue-encoding properties of these cells. Furthermore, optogenetic stimulation of mPOANts-VTA circuitry promotes rewarding phenotypes, social approach and striatal dopamine release. Collectively, these data demonstrate that steroid-sensitive mPOA neurons encode ethologically relevant stimuli and co-opt midbrain reward circuits to promote prosocial behaviors critical for species survival.


Conflict of interest statement

The authors declare no competing financial interests.

Figures

Figure 1
Figure 1
Identification of a molecularly-defined population of steroid-responsive mPOA-VTA neurons. (a) Confocal images represent mPOANts::eYFP (teal) and Retrobead aggregates from the VTA (magenta). mPOA: medial preoptic area, VTA: ventral tegmental area; Nts: neurotensin, eYFP: enhanced yellow fluorescent protein, D: dorsal, V: ventral, M: medial, L: lateral. Left scale bar, 100 μm, right scale bar 20 μm. (b) Schematic illustrates mPOANts projections to the VTA and pie chart shows the percentage of mPOA neurons that contain VTA Retrobeads and/or Nts-eYFP. (c) Confocal image of Nts mRNA. BNST: bed nucleus of the stria terminalis; AC: anterior commissure, Scale bar: 100 μm. (d) Confocal image of ESR1 mRNA. ESR1: estrogen receptor 1/α gene. (e) Confocal image of Gal mRNA. Gal: galanin gene. (f) Overlay of Nts, ESR1, and Gal mRNA in the mPOA. Scale bar 60 μm. (g) Pie chart illustrates the percentage of ESR1 and Gal overlap within Nts positive cells.
Figure 2
Figure 2
mPOANts neurons dynamically encode social odor cues. (a) Top: schematic of in vivo Ca2+ imaging in mPOANts::GCaMP6 cells in head-fixed mice in conjunction with delivery of vaporized mouse urine. GRIN, gradient refractive index lens. Bottom: females had a higher behavioral preference index for male urine over female urine (error bars, ± s.e.m., paired t-test, t17 = 4.215, P = 0.0006, n = 9–10 mice). (b) Top: representative mPOANts::GCaMP6 cells acquired from two-photon imaging (scale bars cannot be accurately provided, as two-photon recording through a GRIN lens distorts the imaging plane). Middle: each row of the heat plot represents the Ca2+ response of an individual mPOANts::GCaMP6 neuron during each male (top) or female (bottom) trial of odor delivery. Vertical axis: normalized Ca2+ fluorescence (F/FAVG). Bottom: Ca2+ trace from the same neuron averaged across the 6 male or female odor trials. (c) Each row of the heat plot depicts the Ca2+ response of an individual mPOANts::GCaMP6 neuron averaged across the 6 male (left plot) or female (right plot) odor trials. Heat plots are indexed in the same order for odor type comparison and cells were sorted by male odor response (n = 153 cells combined across 4 mice). (d) Pie charts show the percentage of mPOANts::GCaMP6 cells significantly excited or inhibited by male or female odors (Wilcoxon t-test, all P < 0.05, n = 153 cells combined across 4 mice). (e) Ca2+ traces averaged across male or female trials from mPOANts::GCaMP6 cells significantly excited by male odor (error bands, ± s.e.m.; paired t-test, t56 = 4.89, P < 0.0001, n = 57 cells combined across 4 mice).
Figure 3
Figure 3
mPOANts neurons encode reproductive male cues in a steroid-gated manner. (a) Top: schematic illustrating chronic Ca2+ imaging in mPOANts::GCaMP6 cells on separate hormone-treated days. Bottom: ovariectomized females had a higher behavioral preference for male urine following estradiol (blue) compared to vehicle (black) (error bars, ± s.e.m., paired t-test, t5 = 5.85, P = 0.0021, n = 6 mice). (b) Top: each row of the heat plot represents the Ca2+ response during each male odor trial from an individual mPOANts::GCaMP6 cell imaged across treatment days. Vertical axis: normalized Ca2+ fluorescence (F/FAVG). Scale bar, 10 s. Bottom: Ca2+ traces from the same neuron averaged across the 7 male odor trials. Scale bar: x, 10 s; y, 30% ÆF/F. Veh, vehicle oil; E2, estradiol. (c) Each row of the heat plot depicts the Ca2+ response of an individual mPOANts::GCaMP6 cell averaged across male odor trials and imaged after vehicle (left plot) or estradiol (right plot). Heat plots are indexed in the same order for comparison and cells were sorted by male odor response following estradiol replacement. Scale bar, 10 s (n = 230 cells combined across 4 mice). (d) Averaged Ca2+ traces from mPOANts::GCaMP6 cells significantly excited by male odor after estradiol compared to their response after vehicle. Scale bar: x, 10 s; y, 20% ÆF/F (gray shading represents ± s.e.m., paired t-test, t49 = 8.98, P < 0.0001, n = 51 cells combined across 4 mice). (e) Pie charts represent the percent of cells significantly excited (green) or inhibited (blue) by male odor by treatment (Wilcoxon t-test, all P < 0.05, n = 230 cells combined across 4 mice). (f) Pie charts represent the percent of cells significantly excited (green) or inhibited (blue) by female odor by treatment (Wilcoxon t-test, all P < 0.05, n = 230 cells combined across 4 mice).
Figure 4
Figure 4
mPOANts encoding comparison of social and nonsocial odor cues. (a) Spatial map of cell outlines in response to distinct odor cues. Mask displays binary odor response of cells excited by male odor (blue), female odor (pink), both male and female odor (yellow), non-social peanut oil odor (orange), all odors (purple), or none of the odors (white). (b) Example Ca2+ trace from 3 neurons indicated by arrows in the spatial map. Traces were averaged across 7 odor trials for male urine, female urine, or peanut oil. (c) Each row of the heat plot depicts the Ca2+ response of an individual mPOANts::GCaMP6 neuron averaged across male (left plot), female (middle plot), or peanut (right) odor trials. Heat plots are indexed in the same order for comparison and cells were sorted by male odor response. Scale bar; 10 s (n = 155 cells combined across 3 mice). PN: peanut oil. (d) Pie charts show the percentage of mPOANts::GCaMP6 cells significantly excited or inhibited by male, female, or peanut odors (Wilcoxon t-test, all p values < 0.05, n = 155 cells combined across 3 mice).
Figure 5
Figure 5
Estradiol enhances neuronal excitability in mPOANts neurons. (a) Two-photon image of the same mPOANts::GCaMP6 cells imaged after vehicle or estradiol priming. (b) Example Ca2+ traces showing normalized fluorescence F/F0 of GCaMP6s Ca2+ dynamics from the same mPOANts::GCaMP6 on different treatment days. Pre, vehicle 1 week before estradiol replacement; E2 prime, 5 h after estradiol; post, vehicle 1 week after estradiol (b–d). Scale bar: x, 20 s; y, 20% ÆF/F. (c) mPOANts::GCaMP6 cells displayed Ca2+ events longer in duration after estradiol treatment (bars are means; data points, individual cells; repeated-measures (RM) ANOVA, F2,252 = 35.46, P < 0.0001, n = 143 cells combined across 4 mice). (d) mPOANts::GCaMP6 cells displayed Ca2+ events higher in amplitude after estradiol treatment (error bars, ± s.e.m., RM one-way ANOVA, F2,252 = 17.32, P < 0.0001, n = 143 cells combined across 4 mice). (e) Example traces of current-clamp recordings in mPOANts::eYFP cells from ovariectomized mice by treatment. Scale bars: x, 200 ms; y, 25 mV. In eg, black represents vehicle; blue, estradiol. (f) mPOANts::eYFP cells from estradiol-treated mice have more evoked action potentials with increasing current (error bars, ± s.e.m.; two-way ANOVA, interaction F16,240 = 32.40, P < 0.0001, vehicle: n = 8 cells, E2: n = 9 cells; 3 mice per group). (g) Inset: representative action potential from recordings in a mPOANts::eYFP cell by treatment. Scale bars: x, 2 ms, y, 25 mV. Correlation plot: mPOANts::eYFP cells from estradiol-treated mice were correlated with a decrease in spike half-width (error bars, ± s.e.m., Pearson R2 = 0.53, P = 0.0010, vehicle: n = 8 cells, E2: n = 9 cells, 3 mice per group). (h) Inset: Example traces of A-type isolated potassium channel recordings in mPOANts::eYFP cells by treatment. Scale bars: x, 25 ms; y, 2.5 nA. Graph: A-type potassium current conductance is greater in mPOANts::eYFP cells treated with estradiol (error bars, ± s.e.m.; two-way ANOVA, interaction F11,308 = 5.88, P < 0.0001, vehicle: n = 13 cells, E2: n = 17 cells, vehicle: 2 mice; E2: 3 mice).
Figure 6
Figure 6
Stimulation of mPOANts neurons is reinforcing in both sexes. (a) Schematic depicting viral and optogenetic approach for stimulation of mPOANts neurons. (b) Confocal image of mPOANts ChR2-eYFP expression (green) and DAPI (blue). vBNST: ventral bed nucleus of the stria terminalis, AC: anterior commissure, OX: optic chiasm, D: dorsal, V: ventral, M: medial, L: lateral; scale bar, 200 ìm. (c) Confocal image of mPOANts ChR2-eYFP (green) and DAPI (blue). Scale bar, 20 ìm. (d) Cumulative nose poke performed for self-stimulation in each stage of the estrous cycle from a representative mPOANts::ChR2 female mouse. P: proestrus, E: estrus, DI: metestrus, DII: diestrus. (e) mPOANts::ChR2 female mice readily nosepoke in the active port to obtain photostimulation and mPOANts::eYFP controls do not. mPOANts::ChR2 females poke more in proestrus compared to all other stages (error bars, ± s.e.m., two-way ANOVA, interaction F3,27 = 12.70, P < 0.0001, ChR2 n = 5, eYFP = 6 mice). Individual data points are shown as gray lines. (f) Color heat maps illustrating the spatial location in the real-time place preference for a representative mPOANts::ChR2 female and mPOANts::eYFP control mouse in proestrus. (g) mPOANts::ChR2 female mice spent significantly more time in the photostimulation side of the chamber in all stages compared to mPOANts::eYFP females and had a higher preference in proestrus compared to estrus and metestrus (error bars, ± s.e.m., two-way ANOVA, interaction F3,30 = 9.44, P = 0.0002, ChR2 n = 5, eYFP = 7 mice). (h) mPOANts::ChR2 female mice spent significantly more time in the photostimulation side of the chamber compared to the non-photostimulation side in all stages of the cycle (error bars, ± s.e.m., two-way ANOVA, interaction F3,24 = 15.2, P < 0.0001, ChR2 n = 5, eYFP = 5 mice). (i) mPOANts::ChR2 males spent significantly more time in the stimulation side of the chamber compared to mPOANts::eYFP controls, with no effect of day (error bars, ± s.e.m., two-way ANOVA, group effect, F1,9 = 63.1, P < 0.0001, n = 5–6 mice per group). (j) mPOANts::ChR2 male mice spent significantly more time in the photostimulation side of the chamber compare to the non-photostimulation on all 4 d (error bars, ± s.e.m., two-way ANOVA, group effect F1,8 = 92.75, P < 0.0001, n = 5 mice per group).
Figure 7
Figure 7
Stimulation of mPOA–VTANts neurons is reinforcing and evokes striatal dopamine release. (a) Top: optogenetic stimulation targeted at mPOANts::ChR2 neurons or mPOA–VTANts::ChR2 projecting fibers. Bottom: confocal image of mPOA–VTANts::ChR2 projecting fibers (green) and TH expression (magenta) in the VTA. TH: tyrosine hydroxylase, D: dorsal, V: ventral, M: medial, L: lateral. Left scale bar, 200 ìm. Right scale bar, 20 ìm. (b) mPOA::ChR2 and mPOA–VTANts::ChR2 mice spent more time on the photostimulation side of the chamber, and this was amplified following estradiol priming compared with that in vehicle controls (error bars, ± s.e.m.; two-way ANOVA, interaction F4,24 = 7.04, P = 0.0007, n = 5 or 6 mice per group). (c) Schematic depicting optogenetic targeting of mPOA–VTANts::ChR2 projecting fibers in conjunction with fast-scan cyclic voltammetry (FSCV) to detect dopamine release in the nucleus accumbens (NAc) of the ventral striatum. (d) Photostimulation mPOA–VTANts::ChR2 projecting fibers increased dopamine concentrations in the ventral striatum, and concentrations were higher in estradiol-treated mice (error limits, ± s.e.m., two-way ANOVA, interaction F149,1490 = 1.42 P = 0.0012, n = 6 mice per group). Blue bar indicates optical stimulation (3 s, 20 Hz). Inset: average background-subtracted cyclic voltammograms demonstrating characteristic oxidation and reduction peak potentials that identify dopamine. (e) Estradiol treatment resulted in a higher area under the curve (increased dopamine concentrations) during photostimulation of mPOA–VTANTS:ChR2-eYFP fibers. (error bars, ± s.e.m.; unpaired t-test, t5.971 = 3.328, P = 0.016, n = 6 mice per group).
Figure 8
Figure 8
Optogenetic modulation of mPOANts neurons regulates social attraction. (a) Schematic illustrating the social preference test for an adult male or female conspecific, tested during alternating periods of light delivery. (b) Representative color heat maps displaying the spatial location of a steroid-primed mPOANts::ChR2 female and steroid-primed mPOANts::eYFP control mouse in the social preference test. (c) Photoactivation enhanced male preference in mPOA::ChR2 and mPOA–VTANts::ChR2 mice previously primed with steroids (error bars, ± s.e.m.; one-way ANOVA, F4,21 = 6.82, P = 0.0011, n = 5 or 6 mice per group). Colors and key legends are shown in e for ce. Asterisk denotes mice that received prior but not recent estradiol and progesterone priming. (d) Photoactivation increased the amount of time spent in the male zone in mPOA::ChR2 and mPOA–VTANts::ChR2 mice previously primed with steroids (error bars, ± s.e.m.; two-way ANOVA, interaction F4,21 = 6.35, P = 0.0016, n = 5 or 6 mice per group). (e) Photoactivation did not increase the amount of time spent in the female zone (error bars, ± s.e.m., two-way ANOVA, interaction F4,21 = 1.33, P = 0.29, eYFP n = 6, ChR2 n = 5). (f) Representative color heat maps displaying the spatial location of a steroid-primed mPOANts::NpHR female and steroid-primed mPOANts::eYFP control mouse in the social preference test. (g) Steroid-primed mPOANts::NpHR females had a lower male preference during light delivery, compared to steroid-primed mPOANts::eYFP controls (error bars, ± s.e.m.; two-way ANOVA, interaction F1,12 = 7.15, P = 0.02, n = 7 mice per group). (h) Steroid-primed mPOANts::NpHR females spent less time in the male interaction zone during light delivery, compared to steroid-primed mPOANts::eYFP controls (error bars, ± s.e.m., two-way ANOVA, interaction F1,12 = 9.8, P = 0.009, n = 7 per mice group). (i) Illustration of a behavioral odor preference assay comparing the animal’s time in the zone containing male urine or saline. (j) Steroid-primed mPOANts::NpHR females spent less time in the male odor zone during light delivery, compared to steroid-primed mPOANts::eYFP controls (error bars, ± s.e.m., two-way ANOVA, laser effect F3,33 = 6.05, P = 0.0021, n = 7 mice per group). (k) Photoinhibition decreased the preference index for male odor in mPOANts::NpHR females (error bars, ± s.e.m., unpaired t-test, t11 = 8.30, P < 0.0001, n = 6–7 mice per group). *P < 0.05; **P < 0.01; ***P < 0.001.

Comment in

  • Addicted to love?
    Stanley SA. Stanley SA. Sci Transl Med. 2017 Feb 22;9(378):eaam6067. doi: 10.1126/scitranslmed.aam6067. Sci Transl Med. 2017. PMID: 28228599
  • Setting the mood for love.
    Dölen G. Dölen G. Nat Neurosci. 2017 Feb 23;20(3):379-380. doi: 10.1038/nn.4514. Nat Neurosci. 2017. PMID: 28230842 No abstract available.

References

    1. Anderson DJ, Adolphs R. A framework for studying emotions across species. Cell. 2014;157:187–200. - PMC - PubMed
    1. Yang T, Shah NM. Molecular and neural control of sexually dimorphic social behaviors. Curr Opin Neurobiol. 2016;38:89–95. - PMC - PubMed
    1. Dulac C, O’Connell LA, Wu Z. Neural control of maternal and paternal behaviors. Science. 2014;345:765–770. - PMC - PubMed
    1. McHenry JA, Rubinow DR, Stuber GD. Maternally responsive neurons in the bed nucleus of the stria terminalis and medial preoptic area: Putative circuits for regulating anxiety and reward. Front Neuroendocrinol. 2015;38:65–72. - PMC - PubMed
    1. Yoest KE, Cummings JA, Becker JB. Estradiol, dopamine and motivation. Cent Nerv Syst Agents Med Chem. 2014;14:83–89. - PMC - PubMed

Online Methods References

    1. Leinninger GM, et al. Leptin Acts via Leptin Receptor-Expressing Lateral Hypothalamic Neurons to Modulate the Mesolimbic Dopamine System and Suppress Feeding. Cell Metabolism. 2009;10:89–98. - PMC - PubMed
    1. Sparta DR, et al. Construction of implantable optical fibers for long-term optogenetic manipulation of neural circuits. Nat Protoc. 2012;7:12–23. - PMC - PubMed
    1. Chen TW, et al. Ultrasensitive fluorescent proteins for imaging neuronal activity. Nature. 2013;499:295–300. - PMC - PubMed
    1. Resendez SL, et al. Visualization of cortical, subcortical and deep brain neural circuit dynamics during naturalistic mammalian behavior with head-mounted microscopes and chronically implanted lenses. Nat Protoc. 2016;11:566–597. - PMC - PubMed
    1. Edwards DA. Induction of estrus in female mice: Estrogen-progesterone interactions. Hormones and Behavior. 1970;1:299–304.