. 2017 Mar;49(3):349-357.
doi: 10.1038/ng.3781. Epub 2017 Jan 30.

Systematic analysis of telomere length and somatic alterations in 31 cancer types

Affiliations

Systematic analysis of telomere length and somatic alterations in 31 cancer types

Floris P Barthel et al. Nat Genet. 2017 Mar.

Abstract

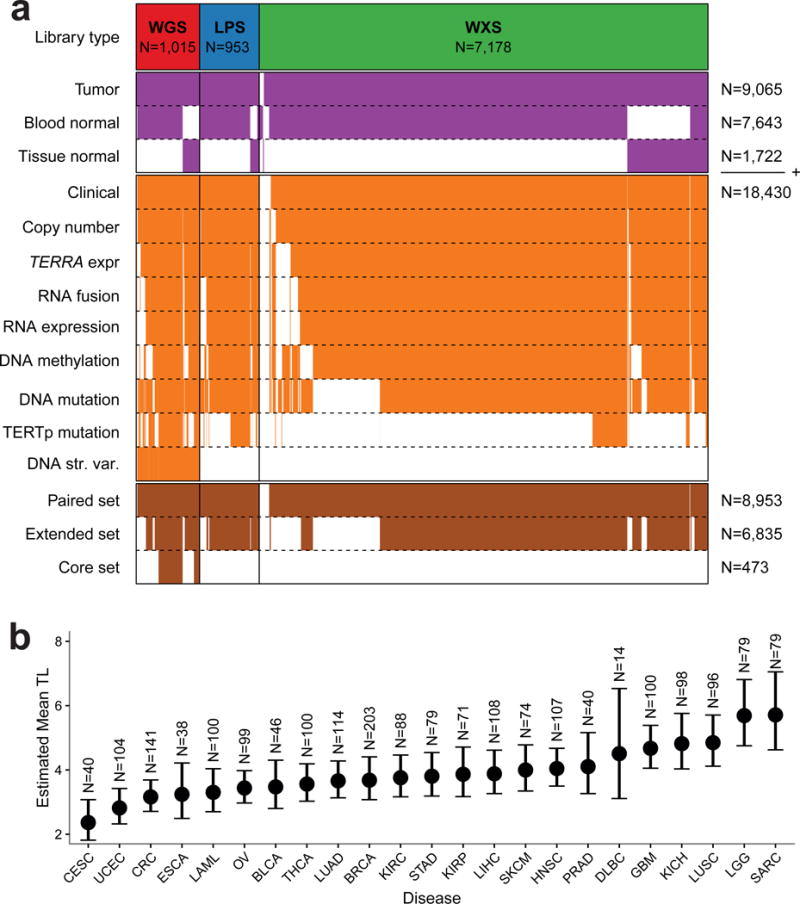
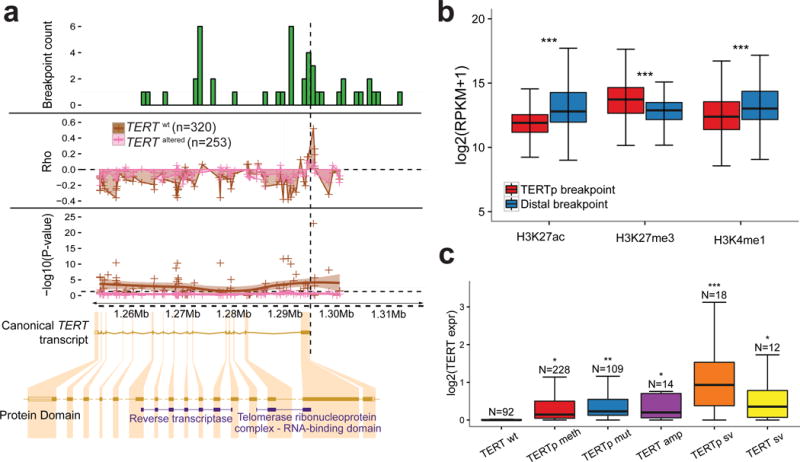
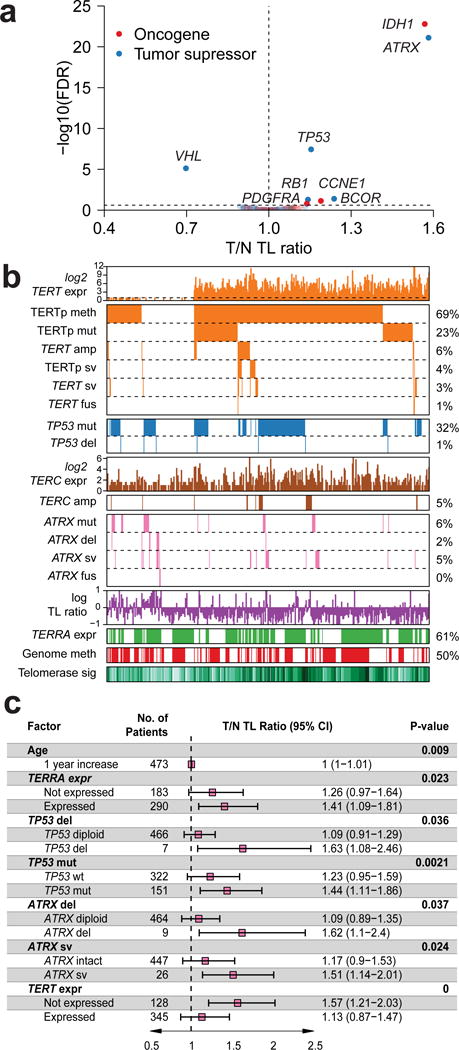
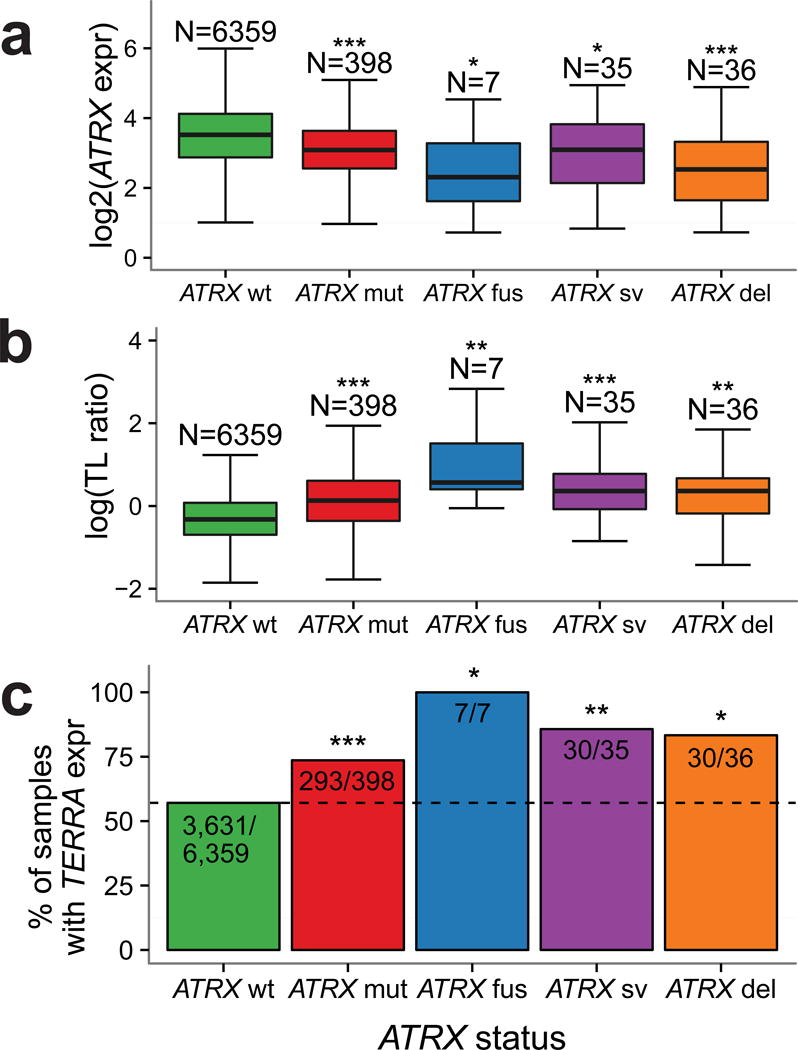
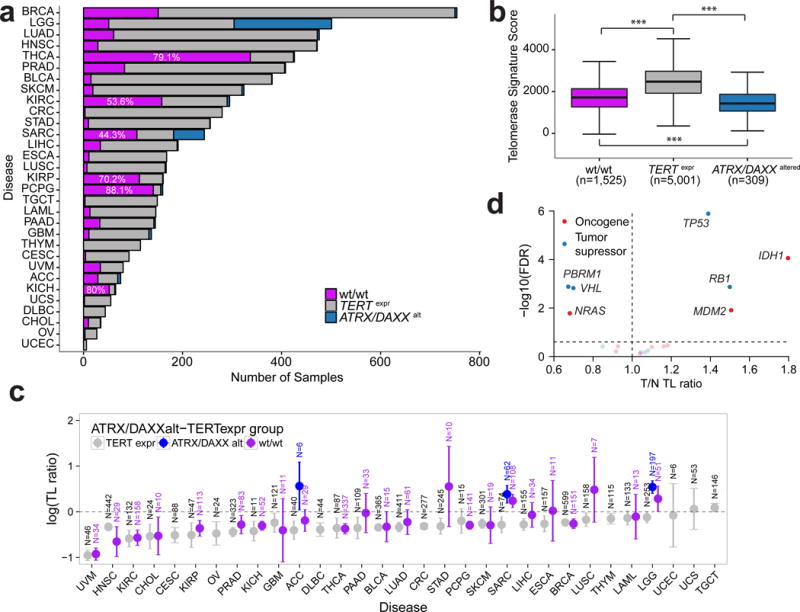
Cancer cells survive cellular crisis through telomere maintenance mechanisms. We report telomere lengths in 18,430 samples, including tumors and non-neoplastic samples, across 31 cancer types. Telomeres were shorter in tumors than in normal tissues and longer in sarcomas and gliomas than in other cancers. Among 6,835 cancers, 73% expressed telomerase reverse transcriptase (TERT), which was associated with TERT point mutations, rearrangements, DNA amplifications and transcript fusions and predictive of telomerase activity. TERT promoter methylation provided an additional deregulatory TERT expression mechanism. Five percent of cases, characterized by undetectable TERT expression and alterations in ATRX or DAXX, demonstrated elongated telomeres and increased telomeric repeat-containing RNA (TERRA). The remaining 22% of tumors neither expressed TERT nor harbored alterations in ATRX or DAXX. In this group, telomere length positively correlated with TP53 and RB1 mutations. Our analysis integrates TERT abnormalities, telomerase activity and genomic alterations with telomere length in cancer.


Conflict of interest statement

COMPETING FINANCIAL INTERESTS

The authors declare no competing financial interests.

Figures

Figure 1
Figure 1. Telomere length in human cancer
(a) Heatmap of patients in the unpaired set (in purple, N=18,430) and fully paired set (in brown, N=8,953). Each column represents a single patient. Rows in orange represent available data depending on platform. The extended set (N=6,835) and core set (N=473) are given in brown. (b) Linear mixed model mean TL estimates using the high-confidence WGS set (N=2,018) by sample type and for each tumor type. Error bars indicate 95% confidence interval. Estimates were adjusted for age, gender and sequencing center. Definitions for tumor type acronyms can be found in the Online Methods.
Figure 2
Figure 2. Multiple modalities associated with TERT overexpression
(a) Top: Histogram of DNA breakpoints in TERT in the core set (n=473). SpeedSeq detected 44 breakpoints aligning to TERT or the TERT promoter in 30 samples. Middle: Smoothed scatter plot of the correlation coefficient and significance of probe-expression correlations for TERT. Each point represents an Illumina 450k probe. The vertical dashed line represents the transcription start site. The analysis was performed separately for TERT wt and TERT altered samples. Bottom: The x-axis is represented by the canonical TERT transcript visualized using the Ensembl browser. Protein domains shown according to Pfam. (b) Boxplot of H3K27ac, H3K27me3 and H3K27me1 levels from the NIH Roadmap Epigenomics dataset at the locations of TERTp structural variant proximal and distal breakpoints (N=17). This dataset consists of 183 biological samples consolidated into 111 epigenomes (Suppl. Methods). P-values were calculated using two-sided t-tests. (c) Boxplot of TERT expression in groups of various TERT alterations. TERT expression in each TERT altered group was compared to the TERT wt group using a two-sided t-test. *** P<0.0001; ** P<0.001; * P<0.05; N.S. not significant.
Figure 3
Figure 3. Multivariable Genomic Determinants of Telomere Length
(a) Scatterplot showing gene to TL ratio associations using the extended set (N=6,835). P-values were calculated using a two-sided t-test and adjusted for multiple testing using FDR. (b) Heatmap of TERT, TERC, ATRX and TP53 expression and somatic alterations in the core set (N=473). TL ratio, TERRA expression and telomerase signature score are also shown. Each column represents a sample. (c) Linear regression analysis of TL ratio. Variables shown are independent predictors of TL in the core set (N=473). Variables from Figure 3b were selected using backwards elimination to derive the final model. R2 = 0.16.
Figure 4
Figure 4. ATRX altered tumors show profound telomere elongation
(a) Boxplot of ATRX expression in groups of ATRX alterations. Only non-synonymous mutations are considered. ATRX expression in ATRX altered groups was compared to the ATRX wt group using a two-sided t-test. (b) Boxplot of TL ratio in groups of ATRX alterations. TL ratio in ATRX altered groups was compared to the ATRX wt group using a two-sided t-test. (c) Barplot indicating the percentage of TERRA expressing tumors per group of ATRX alterations. Proportion of TERRA expressing samples in ATRX altered samples was compared to ATRX wt samples using a two-sided Fisher’s Exact test. *** P<0.0001; ** P<0.001; * P<0.05; N.S. not significant.
Figure 5
Figure 5. A substantial fraction of cancer samples lacks detectable TERT expression and mechanisms of ATRX deactivation
(a) Frequency of TERTexpr-ATRX/DAXXalt groups across cancer types in the extended set. Definitions for tumor type acronyms can be found in the Online Methods. (b) Telomerase signature score by TERTexpr-ATRX/DAXXalt groups. Telomerase signature score between groups was compared using two-sided t-tests. (c) T/N TL ratio by cancer type. TERTexpr-ATRX/DAXXalt groups are shown in different colors. Groups with less than 6 samples were omitted. Error bars indicate 95% confidence interval. Definitions for tumor type acronyms can be found in the Online Methods. (d) Scatterplot showing gene to T/N TL ratio associations within the wt/wt group (N=1,525). P-values were calculated using a two-sided t-test and adjusted for multiple testing using FDR. *** P<0.0001; ** P<0.001; * P<0.01; N.S. not significant.
Figure 6
Figure 6. Telomere position effect
(a) Negative log10(P-value) for genes showing a correlation or an anti-correlation to tumor TL shown relative to the distance to the respective telomere. Spearman correlation tests were conducted individually within cancer types. P-values for N=3,477 genes were averaged across cancer types. (b) Spearman correlation coefficient across all cancer types for N=2,016 genes significantly associated to TL (FDR < 0.25) shown relative to the distance to the respective telomere. (c) Average gene expression (in TPM, transcripts per million) for tumor and normal samples relative to distance to the respective telomere. Mean expression was calculated for N=3,477 genes. (d) Reactome gene expression pathway analysis on the extended set (n=6,835 samples) of the top 500 genes most associated with relative TL elongation and relative TL shortening, respectively. Top ten pathways for each set of 500 genes shown.

References

    1. O’Sullivan RJ, Karlseder J. Telomeres: protecting chromosomes against genome instability. Nat Rev Mol Cell Biol. 2010;11:171–81. - PMC - PubMed
    1. de Lange T. How telomeres solve the end-protection problem. Science. 2009;326:948–52. - PMC - PubMed
    1. Olovnikov AM. A theory of marginotomy. The incomplete copying of template margin in enzymic synthesis of polynucleotides and biological significance of the phenomenon. J Theor Biol. 1973;41:181–90. - PubMed
    1. Shay JW, Pereira-Smith OM, Wright WE. A role for both RB and p53 in the regulation of human cellular senescence. Exp Cell Res. 1991;196:33–9. - PubMed
    1. Stewart SA, Weinberg RA. Telomeres: cancer to human aging. Annu Rev Cell Dev Biol. 2006;22:531–57. - PubMed

MeSH terms