. 2017 Mar;18(3):321-333.
doi: 10.1038/ni.3677. Epub 2017 Jan 30.

The IgM receptor FcμR limits tonic BCR signaling by regulating expression of the IgM BCR

Affiliations

The IgM receptor FcμR limits tonic BCR signaling by regulating expression of the IgM BCR

Trang T T Nguyen et al. Nat Immunol. 2017 Mar.

Abstract

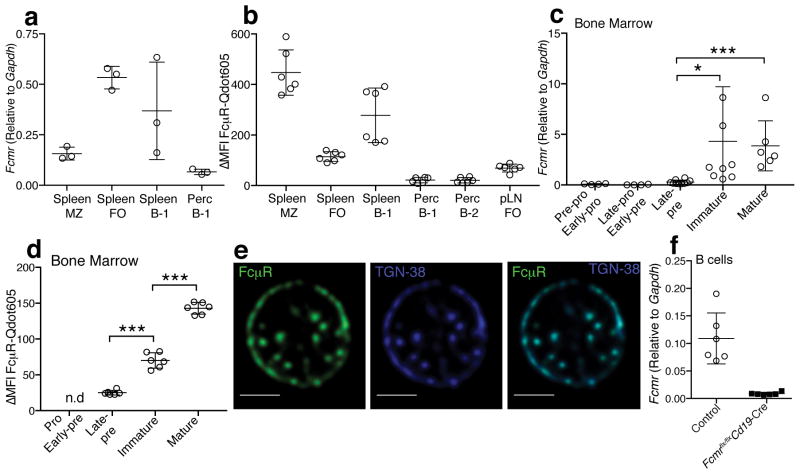
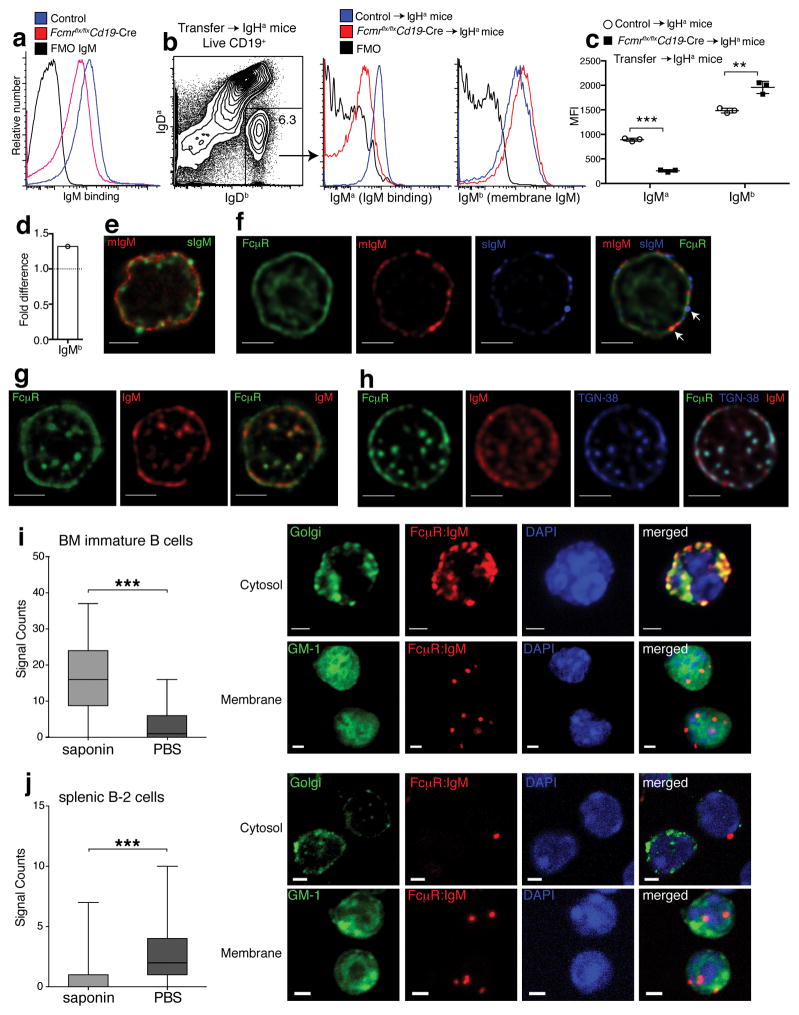
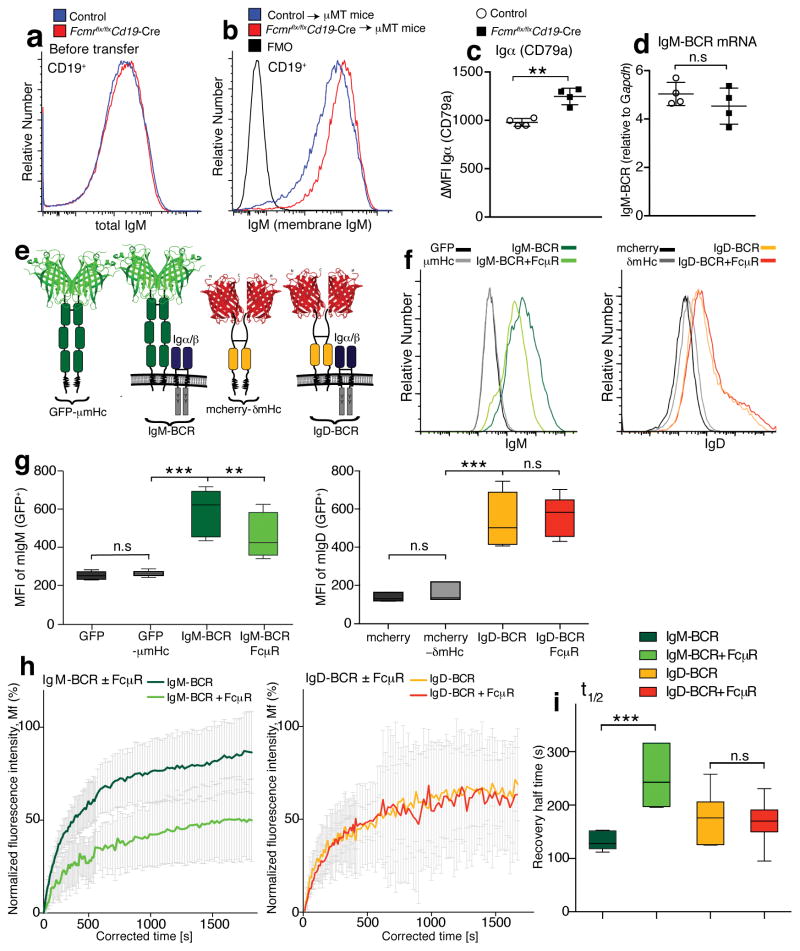
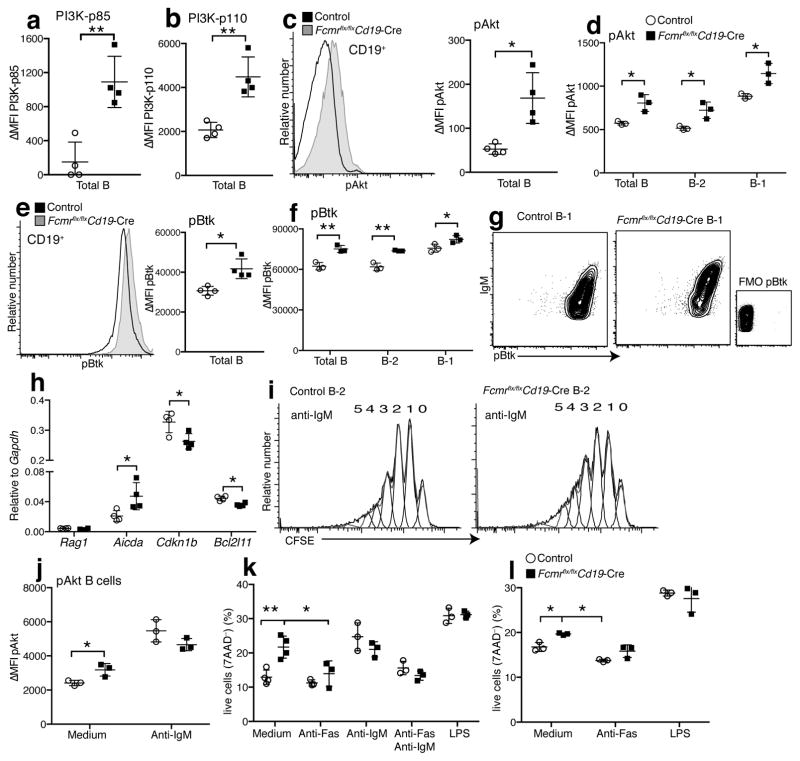
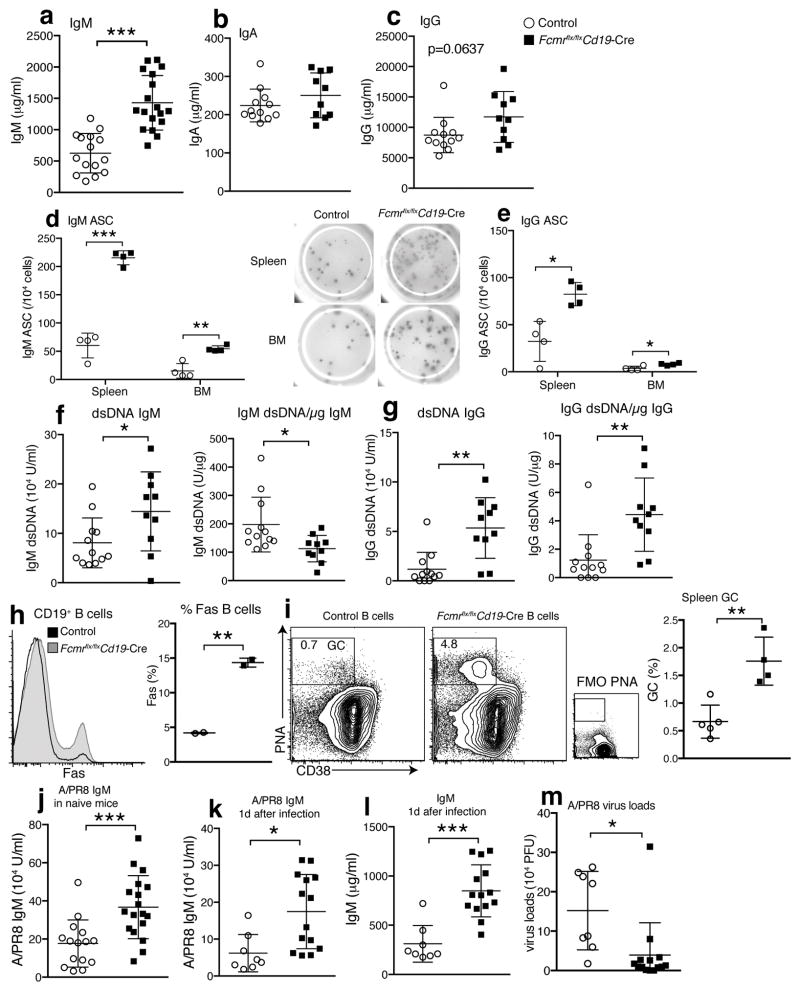
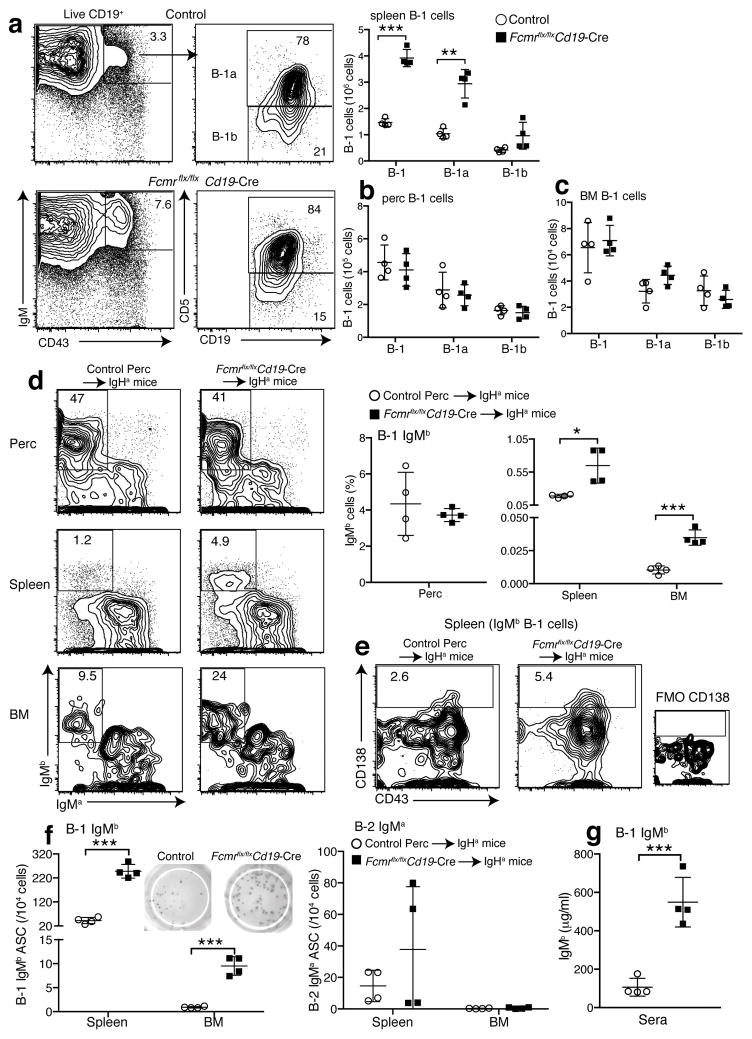
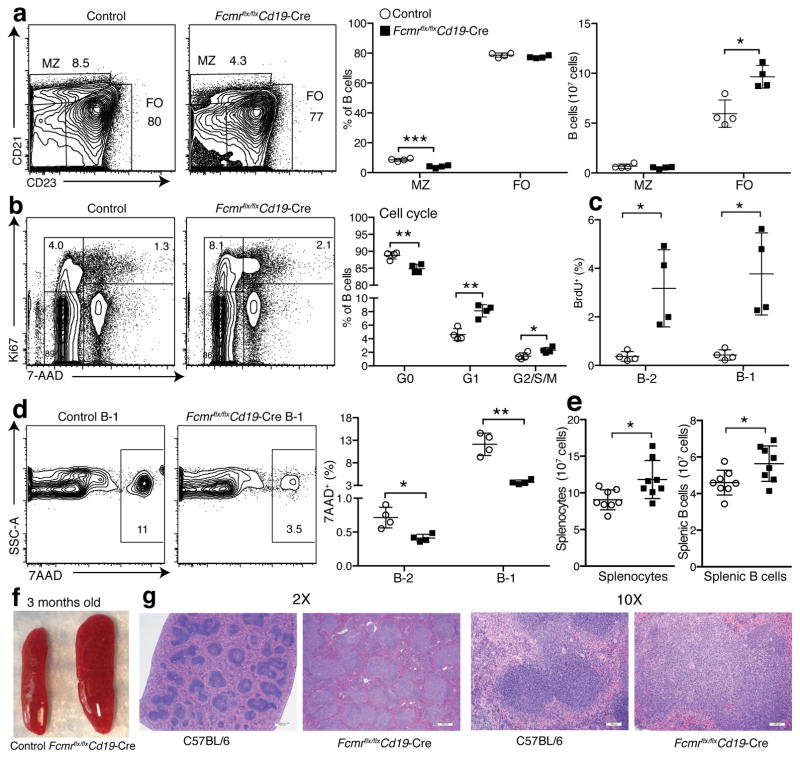
The FcμR receptor for the crystallizable fragment (Fc) of immunoglobulin M (IgM) can function as a cell-surface receptor for secreted IgM on a variety of cell types. We found here that FcμR was also expressed in the trans-Golgi network of developing B cells, where it constrained transport of the IgM-isotype BCR (IgM-BCR) but not of the IgD-isotype BCR (IgD-BCR). In the absence of FcμR, the surface expression of IgM-BCR was increased, which resulted in enhanced tonic BCR signaling. B-cell-specific deficiency in FcμR enhanced the spontaneous differentiation of B-1 cells, which resulted in increased serum concentrations of natural IgM and dysregulated homeostasis of B-2 cells; this caused the spontaneous formation of germinal centers, increased titers of serum autoantibodies and excessive accumulation of B cells. Thus, FcμR serves as a critical regulator of B cell biology by constraining the transport and cell-surface expression of IgM-BCR.


Conflict of interest statement

Competing Financial Interests

The authors declare that no conflict of interest exists.

Figures

Figure 1
Figure 1. The FcμR is expressed by various cell subsets
(a) Fcmr mRNA expressions in different B cell subsets in spleen and peritoneal cavities (perc): marginal zone (MZ), follicular (FO), spleen B-1, and perc B-1 cells. Each symbol represents values from one mouse (n=3 mice). (b) Surface FcμR expression in different B cell subsets in spleen, perc, and inguinal lymph node (pLN) (n=6 mice) (c) Fcmr mRNA expression by different B cell developmental stages (n = 4–10 samples/group, each sample was sorted from BM of 2 mice). (d) Surface FcμR expression by pro- and early pre- B cells, late pre-, immature and mature B cells (n=6 mice). (e) Confocal microscopy of immature B cells stained with FcμR (green) and TGN-38 (blue). White bars indicate 2 μm scale bars. (f) Relative expression of Fcmr mRNA of purified Fcmr flx/flxCd19-Cre and control B cells (n=6 mice/group). Data are combined from 3 independent experiments (c) or are representative of at least two independent experiments (a–b, d–f) (mean ± SD in a–d, f). *p<0.05, **p<0.005, ***p<0.0005 by unpaired two-tailed Student’s t-test.
Figure 2
Figure 2. IgM FcμR interaction occurs with both secreted and membrane IgM
(a) Shown are histogram plots of splenic B cells from control and Fcmr flx/flxCd19-Cre mice incubated or not with biotinylated IgM and stained with streptavidin-PE. (b) Splenocytes from Fcmr flx/flxCd19-Cre and control mice (IgHb) were i.v transferred into C6.IgHa mice (n=3 mice/group). Shown are 5% contour plots with outliers gated on live CD19+ B cells, identifying transferred B cells as IgDa− and IgDb+. (c) Overlay histograms comparing IgMa (in vivo sIgM binding) and IgMb (membrane IgM) expression of transferred B cells (IgDa− IgDb+) from Fcmr flx/flxCd19-Cre and control mice 3 days after transfer. Graph summarizes mean fluorescence intensities ± SD of IgMa and IgMb staining of transferred B cells. (d) Fold-difference in MFI from IgMb (mIgM) of Fcmr flx/flxCd19-Cre B cells compared to controls. (e,f) Follicular B cells unable to secrete IgM (μs −/−) were isolated from mixed BM μs−/− (IgMa) and WT (IgMb) chimeras. (e) STED microscopy of μs−/− B cells stained for sIgM (IgMb-green) and mIgM (IgMa-red). (f) Confocal microscopy of μs −/− follicular B cells stained for FcμR (green), mIgM (IgMa, red), and sIgM (IgMb, blue). White arrows identify co-localization of FcμR with mIgM or sIgM. (g) STED microscopy of immature B cells stained for FcμR (green) and IgM (red). (h) Confocal microscopy of immature B cells stained with FcμR (green), IgM (red) and TGN-38 (blue). Scale bars 2μm. (i–j) Quantified box-and-whisker-plots (min, max, median, quartiles) and microscopic representation of Proximal ligation assay (PLA) of GFP-sorted (i) BM immature (n=250 cells) and (j) splenic mature B cells (n=750 cells) treated with or without saponin prior to PLA, as indicated. Red indicates FcμR-IgM interaction. Green shows staining of Golgi network using labeled lectin-GSII staining (J-top, K-top) or GM-1 staining indicating the cell membrane, using labeled cholera-toxin subunit B (J-bottom, K-bottom). DAPI stained nuclei presented in blue. Scale bar 2μm. Data are representative of at least two independent experiments. *p<0.05, **p<0.005, ***p<0.0005 by unpaired two-tailed Student’s t-test (a–c) or Mann-Whitney test (i–j).
Figure 3
Figure 3. FcμR-mIgM interactions constrain BCR surface expression
(a) Overlay histogram flow cytometry plots comparing total surface IgM staining (membrane plus secreted IgM binding), on splenic CD19+ B cells from Fcmr flx/flxCd19-Cre and control mice. (b) Overlay histograms comparing IgM (membrane IgM) expression on B cells (IgDa− IgDb+) from Fcmr flx/flxCd19-Cre and control mice 3 days after transfer into IgHa mice. (c) Mean fluorescence intensities ± SD of staining for Igα (CD79a) in total spleen B cells from Fcmr flx/flxCd19-Cre and control mice (n=4 mice/group). (d) Mean relative expression of membrane IgM (BCR) mRNA ± SD of purified Fcmr flx/flxCd19-Cre and control B cells (n=4 mice/group). Data are representative of at least two independent experiments. (e) Model of the GFP-μm heavy chain (GFP-μmHc) and the assembled chimeric IgM-BCR containing the CD79a and CD79b signaling subunits, the mcherry-δmHc and the assembled chimeric IgD-BCR expressed in S2 cells. (f) Shown are flow cytometry histogram plots of Drosophila S2 cells stained for IgM or IgD. The cells expressed GFP, GFP-μmHc, mcherry-δmHc, IgM-BCR ± FcμR, IgD-BCR ± FcμR. (g) Box-and-whisker-plots (min, max, median, quartiles) summarize MFI of surface IgM (left) and surface IgD (right) expression by S2 cells after transfection. (h,i) Shown are IgM (left) and IgD (right) re-expression by transfected S2 cells after photobleaching (FRAP) (n=50 cells). The cells expressed the IgM-BCR as GFP-coupled chimera described in (e) and the IgD-BCR GFP-chimera with or without the FcμR. (h) Mean ratios of fluorescence staining of the mobile fraction (Mf) ± SD. (i) Box-and-whisker-plots (min, max, median, quartiles) summarize the half-time recovery. Data are representative of at least two independent experiments (a–d, h–i). Data are combined from five independent experiments (f–g). n.s. not significantly different, *p<0.05, **p<0.005, ***p<0.0005 by unpaired two-tailed Student’s t-test (c,d,i), Wilcoxon matched-pairs signed rank test (g), or Mann-Whitney test (h, ***p<0.0001 for IgM-BCR, and n.s for IgD-BCR).
Figure 4
Figure 4. Enhanced tonic BCR signaling in Fcmr−/− B cells
(a–c) MFI ± SD of ex vivo staining for expression of (a) PI3K-p85 and (b) PI3K-p110 by flow cytometry. (c) Overlay histograms (left) and graph summarizing MFI ± SD of phospho (p)Akt expression by total B cells from Fcmr flx/flxCd19-Cre mice and Fcmr flx/flx Cre-negative controls (right). (d) pAkt expression levels in total spleen B cells, FO B (B-2) and B-1 cells. (e) Overlay histograms of phospho (p)Btk expression by total B cells from indicated mice (left). Graph summarizing MFI ± SD of phospho (p)Btk expression. (f) pBtk expression in total spleen B cells, FO B (B-2) and B-1 cells from Fcmr flx/flxCd19-Cre and control mice (n=3–4 mice/group). (g) 5% contour plots with outliers gated on lived splenic B-1 cells from Fcmr flx/flxCd19-Cre and control mice, showing the correlation of surface IgM and pAkt expression. (h) mRNA expression levels of FOXO target genes Rag1, Aicda, Cdkn1b, and Bcl2l11 in Fcmr flx/flxCd19-Cre and control B cells after normalization to Gapdh (n=4 mice/group). (i) FO B cells isolated from spleens of Fcmr flx/flxCd19-Cre and control mice labeled with CFSE and stimulated with anti-IgM for 72h. Numbers are rounds of cell divisions. (j) pAkt expression levels (ΔMFI= mean fluorescent intensity (MFI) – MFI fluorescence minus one (FMO) control) after 72h culture with/without anti-IgM. (k) FO B-2 cells isolated from Fcmr flx/flxCd19-Cre and control spleens stimulated as indicated for 72h. Frequencies of live cells as determined by 7-AAD staining. (l) Frequencies of live (7-AAD) B-1 cells isolated from Fcmr flx/flxCd19-Cre and control spleens and stimulated as indicated for 48h (n=3 samples pooled from 2 mice (k–l)). Each data set is representative of at least two independent experiments (mean ± SD in a–f, h, j–l). *p<0.05, **p<0.005 by unpaired two-tailed Student’s t-test.
Figure 5
Figure 5. Increased influenza-protective natural IgM and autoantibody production in Fcmr flx/flxCd19-Cre mice
Concentrations of (a) IgM, (b) IgA, (c) IgG in Fcmr flx/flxCd19-Cre and control sera from 3 months old mice (n=10–18 mice/group). (d) Frequencies of IgM and (e) IgG secreting cells in spleens and BMs of these mice (n=4 mice/group). (f) Relative amounts of IgM and (g) IgG anti-dsDNA and relative amounts of anti-dsDNA/mg Ig per μg total Ig in Fcmr flx/flxCd19-Cre and control sera (n=10–12 mice/group). (h) Overlay histograms of Fas expression by B cells from indicated mice (left). Graph summarizing results (right) (n=2 mice/group). (i) 5% contour plots with outliners gated on live CD19+ B cells. Gate and numbers identify CD38low PNA+ germinal center (GC) B cells. Graphs summarize frequencies ± SD GC B cells of total cells in Fcmr flx/flxCd19-Cre and control spleens (n=4–5 mice/group). (j) Relative amounts influenza A/Puerto Rico/8/34-binding IgM in sera from naïve Fcmr flx/flxCd19-Cre and control mice (n=15–18 mice/group). (k) Relative amounts of influenza A/PR8-binding and (l) total IgM in sera of Fcmr flx/flxCd19-Cre, and control mice one day after A/PR8 infection (n=8, 14 mice/group). Data are representative of at least two independent experiments. (m) Lung viral loads at 1 day after A/PR8 infection. For Figure k, l and m data are combined from three independent experiments (mean ± SD in a–m). *p<0.05, **p<0.005, ***p<0.0005 by unpaired two-tailed Student’s t-test.
Figure 6
Figure 6. B-1 cells are responsible for increased natural IgM secretion in Fcmr flx/flxCd19-Cre mice
(a) 5% contour plots with outliers gated for live CD19+ spleen B cells from control and Fcmr flx/flxCd19-Cre mice. B-1 cells were identified as: CD43+ IgMhi CD19hi and CD5+/− (B-1a/B-1b). Graph summarizes numbers of B-1 cells, including B-1a and B-1b cells in spleen, (b) peritoneal cavity and (c) BM (n=4 mice/group). (d–g) Generation of chimeras with Fcmr−/− B-1 (IgHb) and wild-type B-2 (IgHa) cells and controls (n=4 mice/group). (d) (left) 5% contour plots with outliers gated for lived CD19+ B cells from peritoneal cavities and spleens. For BM, cells were pre-gated for B-1 cells (CD19+ IgM+ CD43+). The transferred B-1 cells were identified as IgMb+ IgMa−. Graph provides summary of IgMb B-1 cell frequencies in indicated tissues. (e) 5% contour plots with outliers gated on IgMb+ B-1 cells in spleen. Gates and numbers identify frequencies of CD138+ of IgMb+ B-1 cells. FMO, fluorescence minus one control. (f) Graphs summarize the frequencies of IgMb secreting B-1 (left) and IgMa secreting B-2 cells (right) in spleen, and BMs. (g) Serum IgMb levels in the chimera. Data are representative of at least two independent experiments (a–c) (mean ± SD in a–d, f–g). *p<0.05, **p<0.005, ***p<0.0005 by unpaired two-tailed Student’s t-test.
Figure 7
Figure 7. Increased B cell turnover and cell survival of B cells result in B cell lymphocytosis
(a) 5% contour plots with outliers of representative spleen samples (n=4 mice/group) from Fcmr flx/flxCd19-Cre and control mice analyzed by flow cytometry after gating on live CD19+ B cells. Identified subsets: CD21hiCD23 marginal zone B cells (MZ); CD21intCD23+ follicular B cells (FO) (left). Graph summarizes frequencies (middle) and numbers (right) of MZ and FO in Fcmr flx/flxCd19-Cre and control spleens. (b–c) Cell cycle/turnover analysis of CD19+ live spleen B cells from Fcmr flx/flxCd19-Cre and control mice (n=4 mice/group). (b) 5% contour plots with outliers of live CD19+ B cells from indicated mice, identifying cell cycle stages by Ki67 and 7-AAD staining (G0: Ki67 7AAD, G1: Ki67+ 7AAD; G2/S/M: Ki67+ 7AAD+). Graph summarizes frequencies (n = 4 mice/group). (c) B-2 and B-1 cell turnover was determined by flow cytometry 24h after i.p. injection of BrdU. Shown are frequencies of BrdU+ cells (n=4 mice/group). (d) 5% contour plots with outliers gated on 7AAD+ (dead cells) among splenic live CD19+ CD43+ IgMhi IgDlo B-1 cells (left). Shown are frequencies of 7AAD+ cells (n=4 mice/group; right). (e) Total spleen (left) and B cell counts (right) of indicated mice (n=8 mice/group). (f) Photo of representative spleens from 3-months old control and Fcmr flx/flxCd19-Cre mice. (g) H&E staining of spleens from 8-months old C57BL/6 and Fcmr flx/flxCd19-Cre mice. 2X scale bar is 500μm, 10X scale bar is 100μm. Data are representative of at least two independent experiments. Data are combined from two independent experiments (f) (mean ± SD in a–e). *p<0.05, **p<0.005, ***p<0.0005 by unpaired two-tailed Student’s t-test.

References

    1. Nguyen XH, et al. Toso regulates the balance between apoptotic and nonapoptotic death receptor signaling by facilitating RIP1 ubiquitination. Blood. 2011;118:598–608. - PubMed
    1. Nguyen XH, et al. Antiapoptotic function of Toso (Faim3) in death receptor signaling. Blood. 2012;119:1790–1791. - PubMed
    1. Hitoshi Y, et al. Toso, a cell surface, specific regulator of Fas-induced apoptosis in T cells. Immunity. 1998;8:461–471. - PubMed
    1. Kubagawa H, et al. Identity of the elusive IgM Fc receptor (FcmuR) in humans. The Journal of experimental medicine. 2009;206:2779–2793. - PMC - PubMed
    1. Ouchida R, Mori H, Ohno H, Wang JY. FcmuR (Toso/Faim3) is not an inhibitor of Fas-mediated cell death in mouse T and B cells. Blood. 2013;121:2368–2370. - PubMed

Publication types

MeSH terms