. 2017 May;16(5):587-596.
doi: 10.1038/nmat4848. Epub 2017 Jan 30.

Endocytic reawakening of motility in jammed epithelia

Affiliations

Endocytic reawakening of motility in jammed epithelia

Chiara Malinverno et al. Nat Mater. 2017 May.

Abstract

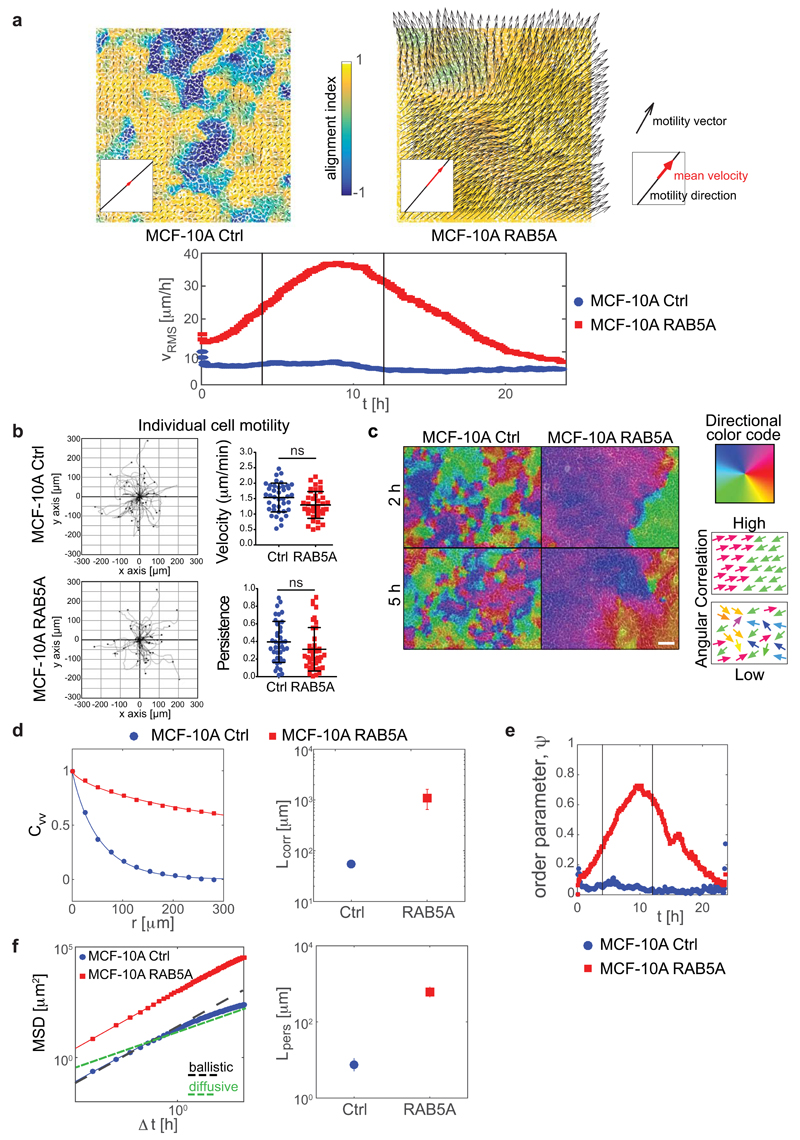
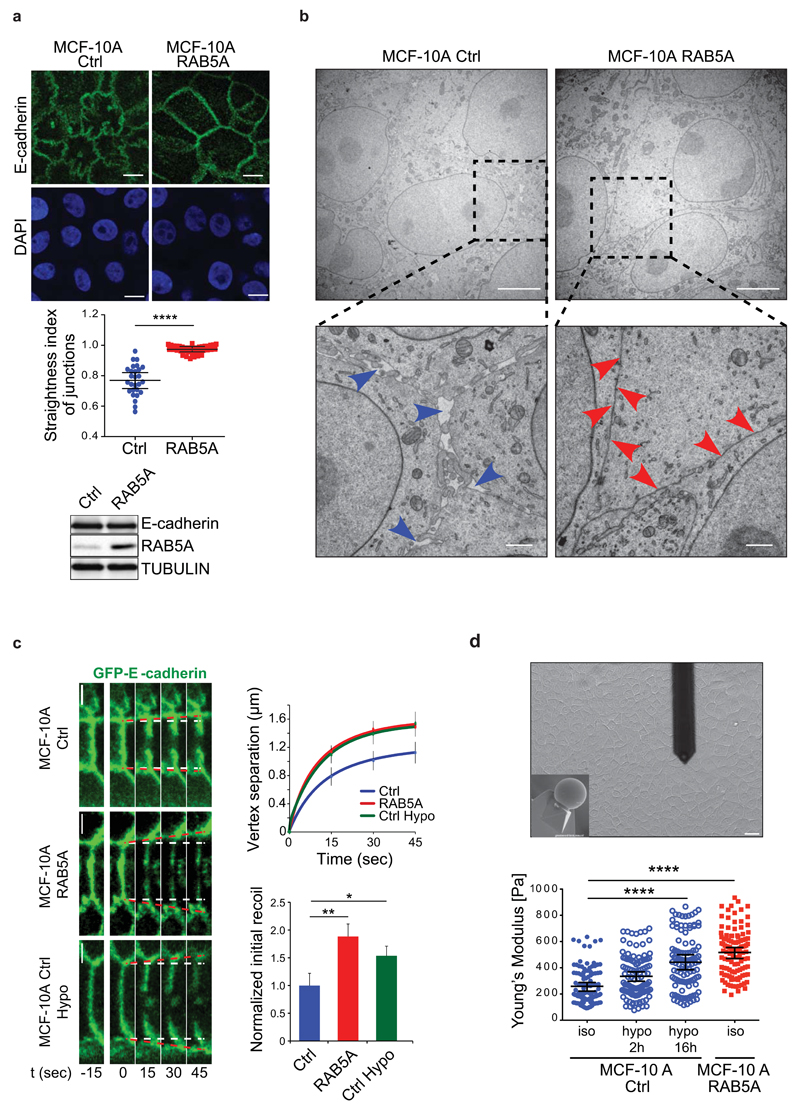
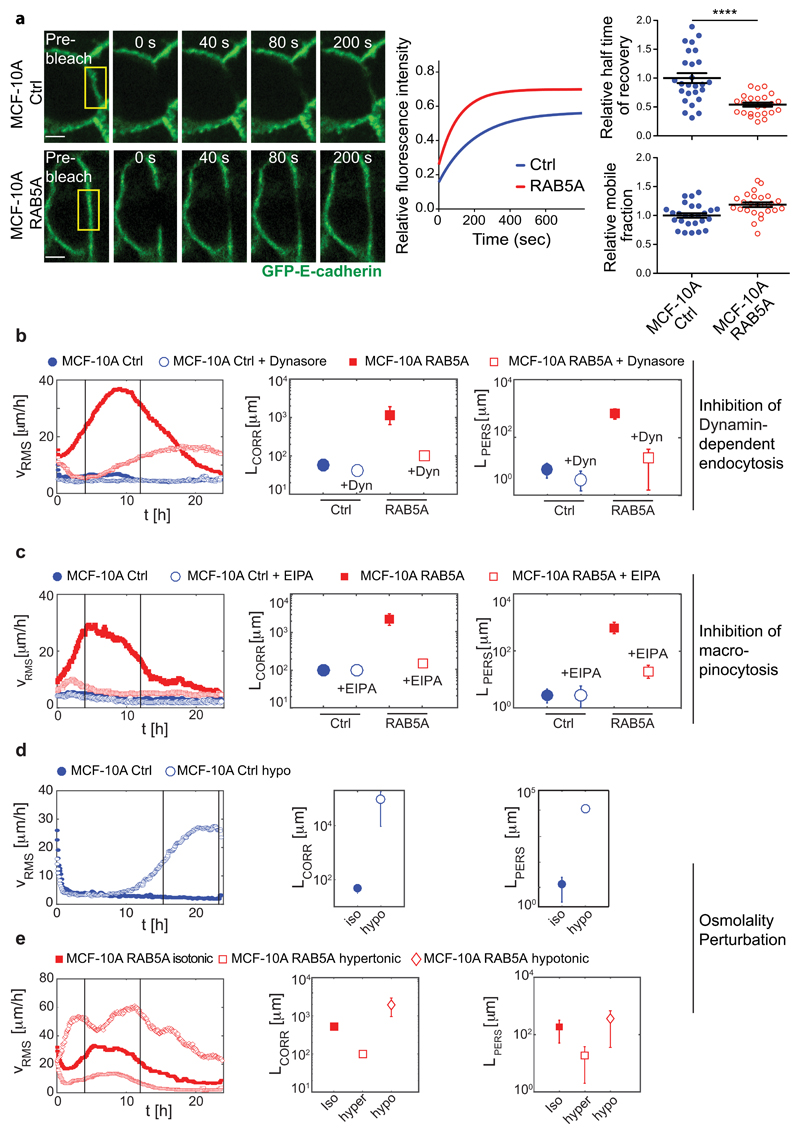
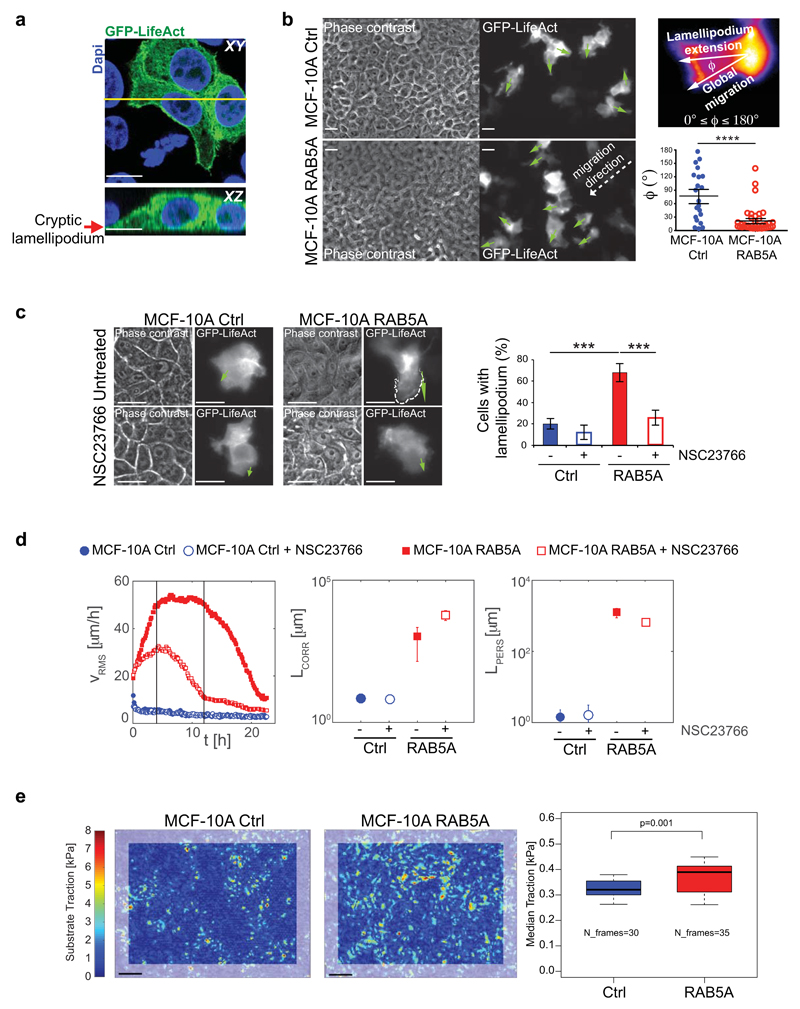
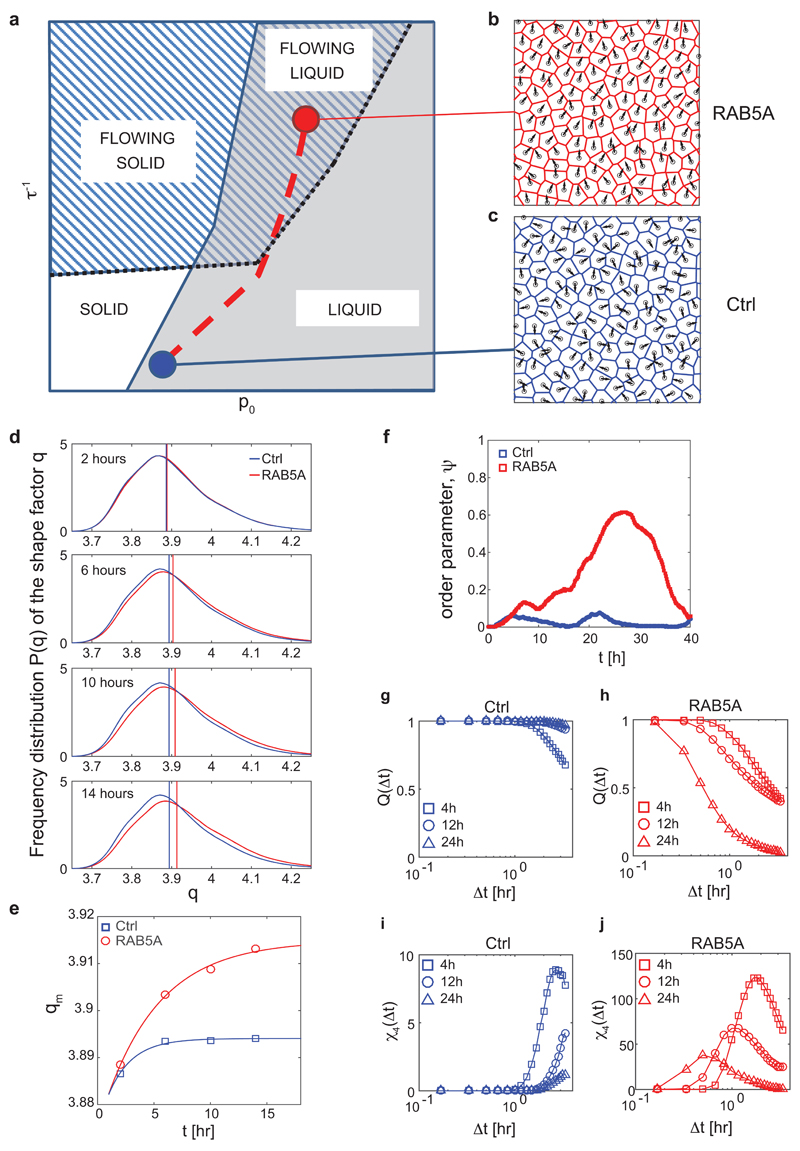
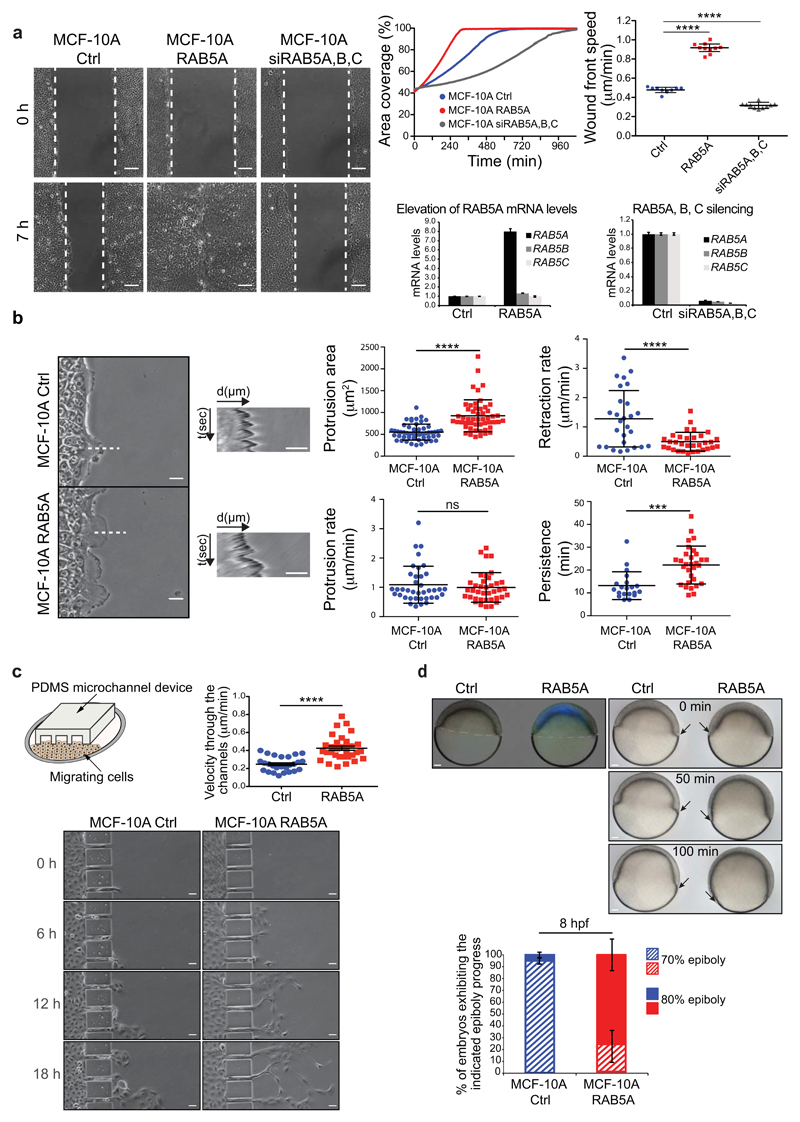
Dynamics of epithelial monolayers has recently been interpreted in terms of a jamming or rigidity transition. How cells control such phase transitions is, however, unknown. Here we show that RAB5A, a key endocytic protein, is sufficient to induce large-scale, coordinated motility over tens of cells, and ballistic motion in otherwise kinetically arrested monolayers. This is linked to increased traction forces and to the extension of cell protrusions, which align with local velocity. Molecularly, impairing endocytosis, macropinocytosis or increasing fluid efflux abrogates RAB5A-induced collective motility. A simple model based on mechanical junctional tension and an active cell reorientation mechanism for the velocity of self-propelled cells identifies regimes of monolayer dynamics that explain endocytic reawakening of locomotion in terms of a combination of large-scale directed migration and local unjamming. These changes in multicellular dynamics enable collectives to migrate under physical constraints and may be exploited by tumours for interstitial dissemination.


Conflict of interest statement

Competing financial interests

The authors declare no competing financial interests.

Figures

Figure 1
Figure 1. RAB5A promotes coherent, ballistic motion of jammed epithelial
(a) Top: Snapshots of the velocity field obtained from PIV analysis of doxycycline-treated control (Ctrl) and RAB5A-(RAB5A)-MCF-10A cells seeded at jamming density and monitored by time-lapse microscopy (Supplementary Movie 2). The red arrow in each inset is the mean velocity υ0 (average over the entire field of view). The colour-map reflects the alignment with respect to the mean velocity, quantified by the parameter a(x) = (υ(x) · υ0)/(|υ(x)||υ0|). The local velocity is parallel (a = + 1) or antiparallel (a = − 1) to the mean direction of migration. Bottom: root mean square velocity υ RMS (representative of > 10 independent experiments). Vertical lines indicate the time interval used for the analysis of motility parameters. (b) Left plots: migration paths of control and RAB5A-MCF-10A cells (Supplementary Movie 6) seeded sparsely to monitor individual cell motility and analysed by Chemotaxis Tool ImageJ software plugin. Right graphs: velocity and persistence of the locomotion of cells. Data are the mean ± SD (n= 40 single cells/experiment/genotype of 3 independent experiments); ns: not significant. (c) Snapshots depicting the angular velocity of control and RAB5A-MCF-10A cells seeded at jamming density and monitored by time-lapse microscopy (Supplementary Movie 7). Angular velocity vectors are calculated by CIV analysis. The colour code indicates the direction of migration. Homogeneous and inhomogeneous scattered colours indicate regions with high and low migration coherence, respectively. Scale bar, 100 μm. Representative images from n=5 time-lapse series. (d-f) PIV analysis of motion of doxycycline-treated control and RAB5A-MCF-10A cells seeded at jamming density (Supplementary Movie 2). In (e), vertical lines indicate the time interval used for the analysis of motility parameters. (d) Left: velocity correlation functions CVV evaluated in the time window comprised between 4 and 12 h during which the availability of EGF allows migration. The continuous lines are best fits of CVV with a stretched exponential function. Right: correlation lengths Lcorr (5 movies/experimental condition out of 3-8 independent experiments). (e) Order parameter 𝜓 as a function of time. 𝜓 = 1 means a perfectly uniform velocity field. 𝜓 ≅ 0 indicates randomly oriented velocities. (f) Left: mean square displacements (MSD) obtained by numerical integration of the velocity maps. Right: persistence length Lpers is obtained by fitting the MSD curves with a model function (continuous lines) describing the transition from a short time ballistic to a long-time diffusive behaviour.
Figure 2
Figure 2. RAB5A alters junctional topology, tension and monolayer rigidity
(a) Top images: confocal apical sections of fully confluent and jammed control and RAB5A-MCF-10A monolayers, stained for E-cadherin (green) and Dapi (blue). Scale bars, 10 μm. Middle plot: the straightness index of junctions was quantified as the ratio of the distance between vertices and the junctional length. Data are the mean ± standard error of the mean (SEM) (n=80 cells in 3 independent experiments/condition). **** p < 0.0001. Bottom: E-cadherin total levels detected by immunoblotting analysis of lysates of control and RAB5A-cells. Tubulin was used as loading control. (b) Representative electron microscopy micrographs of fully confluent control and RAB5A-MCF10-A monolayers (scale bars, 5 µm). Boxes indicate magnified areas shown in the bottom images (scale bars, 1 µm). Blue arrows point to large spaces between cell–cell contacts, red arrows to tight cell–cell contacts. (c) Left images: image sequence of GFP-E-cadherin-positive junctional vertices recoiling after nano-scissor laser ablation at t=0 in control (MCF-10A Ctrl) and RAB5A-MCF-10A cells. GFP-E-cadherin-expressing cells (MCF-10A Ctrl Hypo) incubated with hypotonic buffer were used as positive control. Recoiling vertices were measured as a proxy of junctional tension. White dashed lines indicate starting positions of vertices; red dotted lines indicate expansion of vertices after laser ablation. Top right graph: Initial recoil was measured by the instantaneous rate of vertex separation at t = 0, and computed using best fit single exponential curves. Bottom right plot: Initial recoil rate was normalized with respect to control cells. Data are the means ± SD, normalized to control. (n = 20, 19 and 17 for control, RAB5A and hypo cells, respectively). Scale bars, 5 μm. ** p < 0.001; * p<0.05. (d) Top: representative snapshot of the cantilever touching a MCF-10A monolayer and bottom view of the microsphere (10 µm in diameter) probe of the cantilever (inset). Scale bar, 20 μm. Bottom: Young’s modulus of control and RAB5A-MCF-10A monolayers seeded at jamming density obtained by AFM indentation. Control monolayers were incubated either in isotonic or hypotonic buffers. The position of the AFM indentation was chosen to be the centre of the cell. Young’s modulus was calculated using the Hertz model. Data are the mean ± SEM (n=80 cells/condition of 3 independent experiments). **** p < 0.0001.
Figure 3
Figure 3. Endomembrane trafficking mediates RAB5A-induced collective motility
(a) Left images: Series of images depicting fluorescence recovery after photobleaching (FRAP) of GFP-E-cadherin in the outlined region of interest (yellow box) in fully confluent control and RAB5A-MCF-10A cells (Supplementary Movie 9). Scale bars, 5 μm. Middle graph: representative single-exponential best fit curves of fluorescence recovery. Left plots: the halftime of recovery (top) and mobile fraction (bottom) were calculated from the best-fit curves and are expressed as mean ± SD (n=30 cells/condition of one representative experiment out of three with identical outcome). ****p < 0.0001, calculated with paired Student’s t-test. (b) Dynamin-dependent inhibition of endocytosis impairs RAB5A-induced collective motility. Doxycycline-treated control and RAB5A-MCF-10A monolayers seeded at jamming density were incubated with vehicle or Dynasore (Dyn) 1 h before starting time-lapse recording (Supplementary Movie 10). PIV analysis was applied to extract (from left to right): root mean square velocity υ RMS plotted as a function of time; correlation lengths Lcorr and persistence lengths Lpers. (c) Macropinocytosis inhibition impairs RAB5A-induced collective motility. Doxycycline-treated control and RAB5A-MCF-10A monolayers seeded at jamming were incubated with EIPA [5-(N-Ethyl-N-isopropyl)amiloride] (75 μM) 1 h before starting time-lapse recording (Supplementary Movie 11). From left to right: root mean square velocity υ RMS plotted as a function of time; correlation lengths Lcorr and persistence lengths Lpers obtained from PIV analysis. (d-e) Hypotonic treatment causes MCF-10A monolayer unjamming, while hypertonic stimulation blocks RAB5A-induced collective motility. (d) Jammed control-MCF-10A monolayers were treated with hypotonic media before recording their motility (Supplementary Movie 12). From left to right: temporal evolution of the mean square velocity υRMS, velocity correlation lengths Lcorr and persistence lengths Lpers obtained by PIV analysis. (e) Doxycycline-treated RAB5A-monolayers seeded at a jamming density were incubated with either hypotonic or hypertonic media before recording their motility (Supplementary Movie 13). From left to right: temporal evolution of the mean square velocity υRMS, velocity correlation lengths Lcorr and persistence lengths Lpers obtained by PIV analysis. For all PIV experiments, at least 5 movies/experimental condition were analysed in 3-10 independent experiments. In (b-e), vertical lines indicate the time interval used for the analysis of motility parameters.
Figure 4
Figure 4. RAB5A promotes polarized cell protrusions and traction forces
(a) Mixed (1:10 ratio) GFP-LifeAct-expressing (green):non-expressing control MCF-10A cells were processed for epifluorescence or stained with Dapi (Blue). Arrow points to a cryptic lamellipodium. The yellow line indicates the region of XY projection shown in the XZ plane in the bottom image. Scale bars, 15 µm. (b) Left images: still phase contrast and fluorescent images of the extension and orientation of cryptic lamellipodia in unwounded control and RAB5A-MCF-10A monolayers composed of mixed (1:10 ratio) GFP-LifeAct-expressing (green):non-expressing cells monitored by time-lapse microscopy (Supplementary Movie 14). Green arrows indicate the orientations of protrusions. Scale bars, 15 μm. Top right image: representation of the angle Φ between the direction of each lamellipodium and the direction vector of a moving collective pack (group migration); Φ ~ 0° indicates that protrusions and group migration have the same direction; Φ > 80° indicates that the directions of protrusions and group migration are diverging. Bottom right plot: Quantification of the orientation angle Φ (n= 25/condition from 5 independent experiments). Data are the mean ± SEM. ****p<0.0001 (c) Left images: fluorescent still images depicting cryptic lamellipodia in untreated and NCS23766 (a RAC1 inhibitor)-treated unwounded control and RAB5A-monolayers composed of GFP-LifeAct-expressing (green) and non-expressing cells seeded at a 1:10 ratio and monitored by time-lapse fluorescence microscopy (Supplementary Movie 15). Green arrows indicate the orientation of a typical protrusion. Scale bars, 15 μm. Right plot: Proportion of cells with lamellipodium. Data are the mean ± SD (n=80 cell/condition in 3 independent experiments). ***p < 0.0005. (d) From left to right: temporal evolution of the root mean square velocity υ RMS, velocity correlation lengths Lcorr and persistence lengths Lpers calculated by PIV analysis of control and RAB5A-MCF-10A monolayers seeded at jamming density and treated with the RAC1 inhibitor NSC23766 or vehicle and monitored by time-lapse phase contrast microscopy (Supplementary Movie 16). At least 5 movies/experimental condition were analysed in 3 independent experiments. (e) Left images: substrate tractions of control and RAB5A monolayers measured using cTFM. Grey frames correspond to areas excluded from analysis due to boundary effects. Scale bars, 25 μm. Right plot: the median traction analysed from n time points, obtained from 5-6 fields of view out of 2 independent experiments. p-value calculated with Mann-Whitney-U-Test.
Figure 5
Figure 5. RAB5A induces a collective flowing liquid mode of locomotion
(a) Qualitative phase diagram obtained from simulations. Control parameters are the target shape index p0, encoding the effective junctional line tension and the inverse reorientation time τ-1, expressing the efficiency of the local alignment of self-propelled cell velocities. Two transition lines are present. The first one (continuous blue line) separates the solid (jammed, no mutual re-arrangements of the cells) phase from the liquid phase. This transition is governed by the average shape parameter q, which attains the critical value of q*=3.81 across the transition. A second (dotted black) line separates a flowing phase, where directed collective migration is observed and the order parameter ψ is non-zero, and a non-flowing phase, where no long-range orientational order is present. The dashed red line is a schematic representation of the trajectory in the phase space corresponding to the RAB5A-induced reawakening. (b) Representative snapshot of the simulated monolayer in a flowing liquid state, where both directed collective migration is present and cell rearrangements are allowed (Supplementary Movie 18, right). (c) Representative snapshot of the simulated monolayer in a non-flowing state, close to the solid-liquid transition (Supplementary Movie 18, left). (d) Distributions of the experimentally determined shape parameter q at different stages during the reawakening experiment for Ctrl (blue curves) and RAB5A (red curves). Each curve is obtained from statistics on > 104 cells, followed over a time window of 3 h width and centred, from top to bottom, at 2, 6, 10, 14 h after the beginning of the experiment. Vertical lines represent the median value of the corresponding distribution. (e) Median value of the shape parameter qm during the first stages of reawakening for Ctrl (blue squares) and RAB5A (red circles). (f) Time evolution of order parameter ψ for Ctrl (blue) and RAB5A (red) during the reawakening experiment. (g-h) Average overlap order parameter Q(Δt) for Ctrl [(g), blue] and RAB5A [(h), red] at different stages during the reawakening experiment. Cells seeded at jamming density were treated with doxycycline. Movie recording started 4 h before addition of the drug. Each curve is obtained from reconstructed cell trajectories during a time window of 3 h and centred, respectively, around 4 (squares), 12 (circles) and 24 (triangles) h after the beginning of the experiment. The effect of collective sheet migration, when present, has been removed by correcting each cell trajectory for the average velocity of the monolayer, thus only mutual displacements contribute to Q(Δt). (i-j) Four-point susceptibility χ4(Δt) for Ctrl [(i), blue] and RAB5A [(j), red symbols] at different stages during the reawakening experiment. Sampling intervals and symbols are as in panels (g, h).
Figure 6
Figure 6. Biological consequences of RAB5-induced flowing liquid mode of motion
(a) Left images: scratched wound migration of doxycycline-treated control, RAB5A-MCF-10A, and RAB5A, B and C silenced monolayers (Supplementary Movie 19). Representative still images at the indicated time points are shown. Dashed lines mark the wound edges. Scale bars, 100 μm. Upper right graphs: motility was quantified by measuring (left) the percentage of area covered overtime (calculations made with MatLab software) and (right) the wound front mean speed. Data are the mean ± SD (n=20 independent experiments). Bottom right graphs: the elevation of RAB5A mRNA (left) and the silencing of RAB5A, B and C (right) were verified by qRT-PCR (mRNA fold increase relative to the levels of control cells after normalizing for GAPDH mRNA levels). Data are the mean ± SD (n=20 independent experiments). **** p < 0.0001. (b) Left images: representative still images of the leading edge of wounded control and RAB5A-MCF-10A monolayers. Scale bars, 20 μm. Wound edge dynamics were monitored by time-lapse microscopy (images taken every 30 sec, Supplementary Movie 21). Broken lines indicate areas used to perform kymograph analysis. Middle panels: kymographs of wound edge dynamics. Scale bars, 10 μm. Right plots: protrusion extension, retraction rates, and persistence were determined by Kymograph ImageJ software plugin. Data are the mean ± SD (n=30 kymograph lines/condition of 5 independent experiments). Protrusion area was measured manually by ImageJ software. Data are the mean ± SD (n=30/condition of 4 independent experiments). *** p < 0.001; **** p < 0.0001; ns: not significant. (c) Top left panel: cartoon depicting the migration assay of MCF-10A monolayers moving into PDMS channels. Bottom images: still images of control and RAB5A-MCF-10A cells seeded as monolayers and entering into a micro-fabricated device with micro-channels of 25 μm width at the indicated time points. Scale bars, 25 μm. Top right plot: the velocity of cells passing through the channels was determined manually using Chemotaxis Tool ImageJ software plugin. Data are the mean ± SEM; ****p < 0.001. (d) Top left image: lateral view of wild type (WT) embryos injected with control or mRNA encoding CFP-hRAB5A. Scale bar, 50 µm. Top right images: still images at the indicated time points of lateral views of control and CFP-hRAB5A injected embryos during gastrulation. Arrows indicate mesendodermal cell fronts. Scale bars, 50 µm. Bottom plot: the fraction of embryos at the indicated percentage of epiboly progress was examined at 8 h post fertilization (hpf). Data are the mean ± SD (n=30 embryos, 2 independent experiments).

References

    1. Friedl P, Gilmour D. Collective cell migration in morphogenesis, regeneration and cancer. Nat Rev Mol Cell Biol. 2009;10:445–457. - PubMed
    1. Szabo B, et al. Phase transition in the collective migration of tissue cells: experiment and model. Phys Rev E Stat Nonlin Soft Matter Phys. 2006;74:061908. - PubMed
    1. Angelini TE, Hannezo E, Trepat X, Fredberg JJ, Weitz DA. Cell migration driven by cooperative substrate deformation patterns. Phys Rev Lett. 2010;104:168104. - PMC - PubMed
    1. Angelini TE, et al. Glass-like dynamics of collective cell migration. Proc Natl Acad Sci U S A. 2011;108:4714–4719. - PMC - PubMed
    1. Park JA, et al. Unjamming and cell shape in the asthmatic airway epithelium. Nature materials. 2015;14:1040–1048. - PMC - PubMed

Publication types

Substances