Clinical Trial
. 2017 Jan 30;11(1):e0005263.
doi: 10.1371/journal.pntd.0005263. eCollection 2017 Jan.

Cellular Immune Responses to Live Attenuated Japanese Encephalitis (JE) Vaccine SA14-14-2 in Adults in a JE/Dengue Co-Endemic Area

Affiliations
Clinical Trial

Cellular Immune Responses to Live Attenuated Japanese Encephalitis (JE) Vaccine SA14-14-2 in Adults in a JE/Dengue Co-Endemic Area

Lance Turtle et al. PLoS Negl Trop Dis. .

Abstract

Background: Japanese encephalitis (JE) virus (JEV) causes severe epidemic encephalitis across Asia, for which the live attenuated vaccine SA14-14-2 is being used increasingly. JEV is a flavivirus, and is closely related to dengue virus (DENV), which is co-endemic in many parts of Asia, with clinically relevant interactions. There is no information on the human T cell response to SA14-14-2, or whether responses to SA14-14-2 cross-react with DENV. We used live attenuated JE vaccine SA14-14-2 as a model for studying T cell responses to JEV infection in adults, and to determine whether these T cell responses are cross-reactive with DENV, and other flaviviruses.

Methods: We conducted a single arm, open label clinical trial (registration: clinicaltrials.gov NCT01656200) to study T cell responses to SA14-14-2 in adults in South India, an area endemic for JE and dengue.

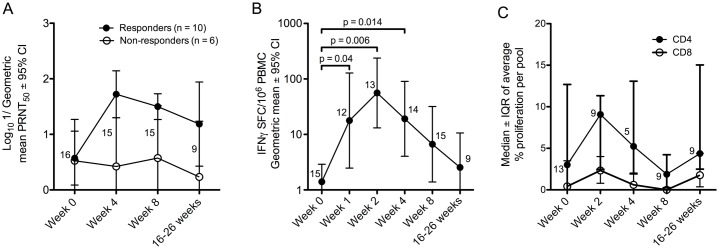
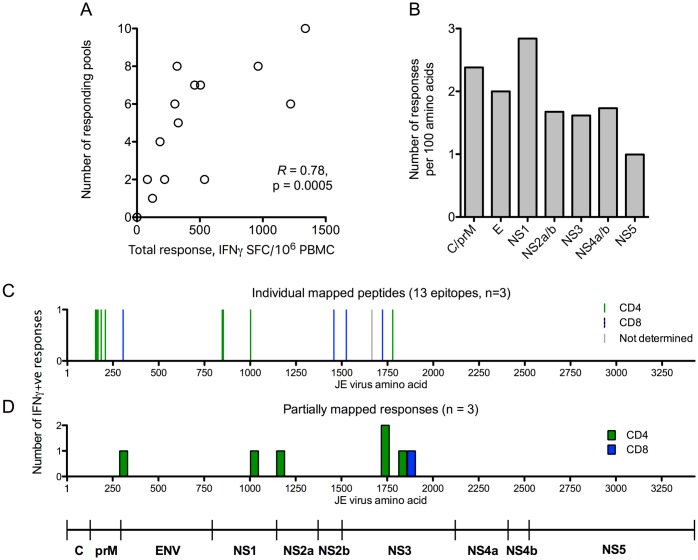
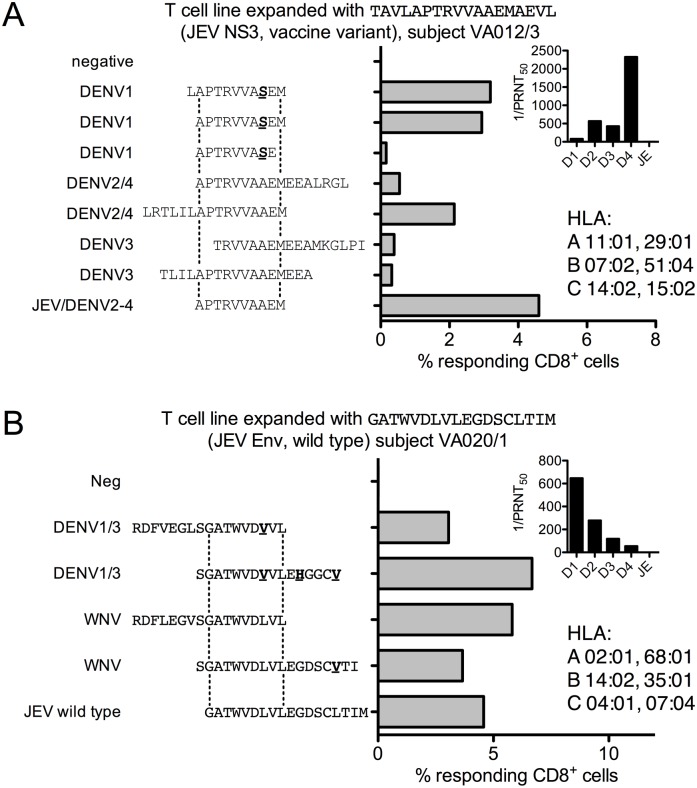
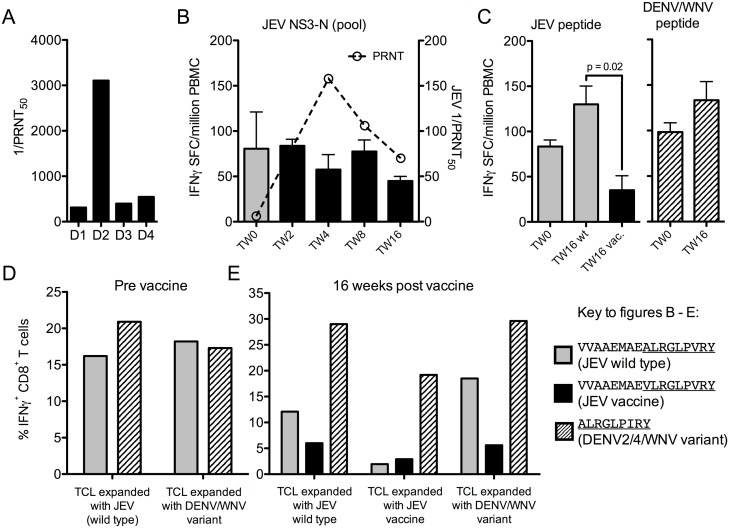
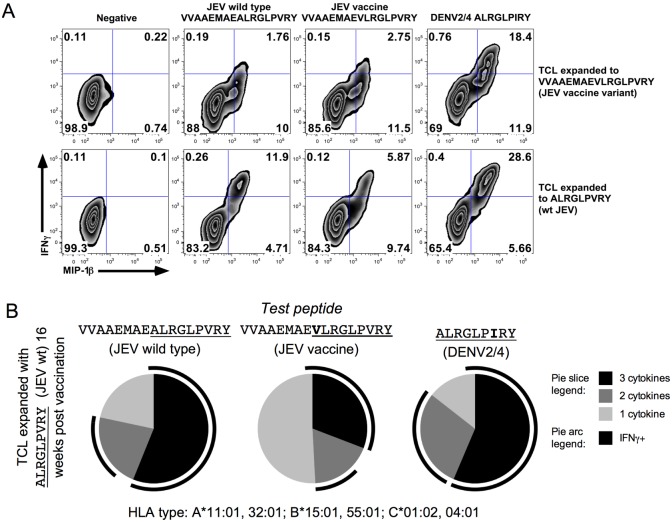
Results: Ten out of 16 (62.5%) participants seroconverted to JEV SA14-14-2, and geometric mean neutralising antibody (NAb) titre was 18.5. Proliferation responses were commonly present before vaccination in the absence of NAb, indicating a likely high degree of previous flavivirus exposure. Thirteen of 15 (87%) participants made T cell interferon-gamma (IFNγ) responses against JEV proteins. In four subjects tested, at least some T cell epitopes mapped cross-reacted with DENV and other flaviviruses.

Conclusions: JEV SA14-14-2 was more immunogenic for T cell IFNγ than for NAb in adults in this JE/DENV co-endemic area. The proliferation positive, NAb negative combination may represent a new marker of long term immunity/exposure to JE. T cell responses can cross-react between JE vaccine and DENV in a co-endemic area, illustrating a need for greater knowledge on such responses to inform the development of next-generation vaccines effective against both diseases.

Trial registration: clinicaltrials.gov (NCT01656200).


Conflict of interest statement

MY is an employee of Vaxyn Consulting. Vaxyn Consulting has no financial interest in JE vaccine SA14-14-2. The other authors have declared that no competing interests exist.

Figures

Fig 1
Fig 1. Antibody and cellular responses to JE vaccine SA14-14-2.
(A) Neutralisation of JEV SA14-14-2 by sera from vaccinated participants at 4 weeks, 8 weeks and 4–6 months after vaccination. Data are the logarithm of the geometric mean of 1/plaque reduction neutralisation titre 50% (PRNT50) ± 95% confidence interval (CI). Filled circles = responders, open circles = non-responders. The number of participants with data at each time point are indicated. (B) IFNγ-ELISpot responses to a peptide library of JEV SA14-14-2 after vaccination. Data are the geometric mean of the sum of spot forming cells (SFC)/106 PBMC for all responding pools (per participant) after subtraction of background wells at each time point ± 95% CI. Non-responding pools were not included. The number of participants is indicated as in (A). Responses were significantly increased over baseline at weeks 1, 2 and 4 (Wilcoxon signed rank test). (C) Proliferation responses in 13 JE vaccinated individuals. Data represent the average % responding cells (CFSElo/CD38hi) measured by flow cytometry across all peptide pools tested in the CD4+ (filled circles) or CD8+ (open circles) gate. Data points are the median and error bars depict the interquartile range (IQR). The number of participants is indicated as in (A).
Fig 2
Fig 2. Example data of JE vaccine specific T cell responses by intracellular cytokine staining (ICS).
Example flow cytometry data from subject VA019/3, who was JEV NAb positive at baseline, throughout the first four weeks of the study are shown. Data are log10 fluorescence units. (A) Example gating strategy; the same strategy was used for all experiments. (B) CD4+ T cell responses at trial week 1 and week 4, measured by overnight stimulation of PBMC with approximately 104.4 PFU JEV SA14-14-2. A transient IL2 single positive response was present at week 1 that was no longer seen over the background at week 4. (C) CD8+ T cell response to wild type JEV infected cell lysate, used at 80 ng/ml JEV E protein concentration at trial week 2, measured by ICS after stimulation of whole blood for six hours. The CD8+ T cell IFNγ response was only detected at week 2, consistent with the peak in ELISpot response (S1 Fig).
Fig 3
Fig 3. Cytokine production by JE vaccine specific T cells by intracellular cytokine staining (ICS).
(A) Magnitude of T cell cytokine responses to JEV SA14-14-2 detected by flow cytometry/ICS in five participants showing positive responses. Data are the percentage of cells in the parent (CD4+/CD8+) gate staining for the indicated cytokine, above unstimulated values. Filled circles = CD4+ responses, open circles = CD8+ responses. Bars = median value of CD4+ responses only. (B) SPICE analysis of CD4+ T cell responses detected by flow cytometry. Data are the proportion of the response comprised of IFNγ+/IL2+/TNFα+ triple positive cells (red pie slices), double positive cells (yellow slices) and single positive cells (blue slices). Arcs indicate the proportion of the response producing individual cytokines: IFNγ (purple arcs), IL2 (green arcs) and TNFα (light grey arcs). Left pie chart: CD4+ responses at weeks 1–4 (n = 4), right pie chart: participant VA001/1 at week 16. Participant VA001/1 made a triple positive response at week 16 after vaccination, hence this participant is presented separately.
Fig 4
Fig 4. Targeting of IFNγ responses to JEV SA14-14-2.
(A) Sum of all responding pools (IFNγ SFC/106 PBMC by ELISpot) against the number of responding pools at the time of maximum ELISpot response per participant in the study. (B) Number of participants responding to each protein of JEV in ELISpot assays, normalised to the protein size as responses per 100 amino acids. (C & D) Peptide pools were deconvoluted by ex-vivo ELISpot, or in ICS assays using T cell lines expanded to peptide pools. Location of epitopes mapped to individual peptides (C) and to “mini-pools” spanning regions 46–90 amino acids in size (D). The Y axes represent the number of responses identified (one of the six “mini-pool” regions identified was recognised by two participants). Subsets were determined by flow cytometry. CD4+ responses: green bars; CD8+ responses: blue bars. The single grey bar in (C) depicts a response identified by ELISpot where the subset was not determined.
Fig 5
Fig 5. Cross-reactivity of anti-JEV IFNγ responses.
(A) cross-reactive T cell responses to variant peptides from dengue virus (DENV) in participant VA012/3. Data are percent IFNγ+ CD8+ T cells from a short-term T cell line expanded with JE vaccine NS3 peptide TAVLAPTRVVAAEMAEVL in an ICS assay to the peptides indicated. Two earlier experiments expanding TCL to wild type and vaccine library peptides, which differ only in a Val/Ala substitution at position 17, outside the region of epitope conservation (dotted lines), gave the same result. Inset: Reciprocal PRNT50 for all four DENV serotypes and JEV; HLA type. (B) cross-reactive T cell responses to variant peptides from West Nile virus and DENV in participant VA020/1. Data are percent IFNγ+ CD8+ T cells from a short-term T cell line expanded with JE vaccine E peptide GATWVDLVLEGDSCLTIM in an ICS assay to the peptides indicated. The dotted lines indicate the region of epitope conservation subsequently shown in another experiment (S4 Fig panel A). Inset: Reciprocal PRNT50 for all four DENV serotypes and JEV; HLA type.
Fig 6
Fig 6. Sub-optimal cross-reactivity of anti-JEV vaccine IFNγ responses in a DENV exposed participant.
(A) Reciprocal DENV PRNT50 were measured for all four DENV serotypes by plaque assay on MK2 cells. (B) NS3 peptide pool IFNγ-ELISpot and NAb responses during the course of the study. (C) IFNγ-ELISpot responses to individual peptides at baseline and 16 weeks. Grey bars = wild type pools or peptide (VVAAEMAEALRGLPVRY), black bars = vaccine pools or vaccine peptide (VVAAEMAEVLRGLPVRY), hatched bars = DENV/2/4WNV peptide (VVAAEMAEALRGLPIRY before vaccination, ALRGLPIRY after vaccination). ELISpot data are presented after subtraction of background values; all responses shown met the criteria for a positive assay (>50 IFNγ-SFC/106 PBMC and double the negative control). The IFNγ-ELISpot response to the JE vaccine peptide was significantly smaller than the response to the wild type peptide at the end of the study (paired t-test). (D) IFNγ responses (percent IFNγ+ CD8+ T cells) of short-term T cell lines (TCL) expanded with JEV and variant peptides before vaccination, and (E) IFNγ responses of TCL 16 weeks after vaccination, tested against both JEV and variant peptides. The peptides used before vaccination were VVAAEMAEALRGLPVRY (JEV) and VVAAEMAEALRGLPIRY (WNV, epitope in common with DENV2/4). After vaccination, TCL were expanded with minimal peptides ALRGLPVRY (JEV) and ALRGLPIRY (DENV2/4, WNV) but tested against library peptides VVAAEMAEALRGLPVRY (wild type JEV) and VVAAEMAEVLRGLPVRY (JE vaccine) in addition to ALRGLPIRY (DENV2/4, WNV).
Fig 7
Fig 7. A sub-optimal cross-reactive CD8+ T cell response dominated by MIP-1β single positive cells.
(A) Flow cytometry data from the same experiment as Fig 6E. Data are log10 fluorescence units, gated on live, CD3+, CD8+ cells. (B) SPICE analysis of 16-week post vaccine TCL responses from the same experiment as in Fig 6E, stimulated with JEV wild type (left), JEV vaccine (centre) and DENV2/4 (right) peptides. Cells were stained for IFNγ, TNFα and MIP-1β; pie slices correspond to the relative proportion of the response made up of triple cytokine+ cells (black), double cytokine+ cells and single cytokine+ cells, which were exclusively MIP-1β+ in this experiment.

References

    1. Campbell GL, Hills SL, Fischer M, Jacobson JA, Hoke CH, Hombach JM, et al. Estimated global incidence of Japanese encephalitis: a systematic review. Bull World Health Organ. 2011;89(10):766–74. 10.2471/BLT.10.085233 - DOI - PMC - PubMed
    1. Sumiyoshi H, Mori C, Fuke I, Morita K, Kuhara S, Kondou J, et al. Complete nucleotide sequence of the Japanese encephalitis virus genome RNA. Virology. 1987;161(2):497–510. - PubMed
    1. Solomon T. Control of Japanese encephalitis—within our grasp? N Engl J Med. 2006;355(9):869–71. 10.1056/NEJMp058263 - DOI - PubMed
    1. Beasley DW, Lewthwaite P, Solomon T. Current use and development of vaccines for Japanese encephalitis. Expert Opin Biol Ther. 2008;8(1):95–106. 10.1517/14712598.8.1.95 - DOI - PubMed
    1. Hoke CH, Nisalak A, Sangawhipa N, Jatanasen S, Laorakapongse T, Innis BL, et al. Protection against Japanese encephalitis by inactivated vaccines. N Engl J Med. 1988;319(10):608–14. 10.1056/NEJM198809083191004 - DOI - PubMed

Publication types

MeSH terms

Associated data