. 2017 Jan 30;12(1):e0171096.
doi: 10.1371/journal.pone.0171096. eCollection 2017.

Human Cord Blood and Bone Marrow CD34+ Cells Generate Macrophages That Support Erythroid Islands

Affiliations

Human Cord Blood and Bone Marrow CD34+ Cells Generate Macrophages That Support Erythroid Islands

Eyayu Belay et al. PLoS One. .

Abstract

Recently, we developed a small molecule responsive hyperactive Mpl-based Cell Growth Switch (CGS) that drives erythropoiesis associated with macrophages in the absence of exogenous cytokines. Here, we compare the physical, cellular and molecular interaction between the macrophages and erythroid cells in CGS expanded CD34+ cells harvested from cord blood, marrow or G-CSF-mobilized peripheral blood. Results indicated that macrophage based erythroid islands could be generated from cord blood and marrow CD34+ cells but not from G-CSF-mobilized CD34+ cells. Additional studies suggest that the deficiency resides with the G-CSF-mobilized CD34+ derived monocytes. Gene expression and proteomics studies of the in vitro generated erythroid islands detected the expression of erythroblast macrophage protein (EMP), intercellular adhesion molecule 4 (ICAM-4), CD163 and DNASE2. 78% of the erythroblasts in contact with macrophages reached the pre reticulocyte orthochromatic stage of differentiation within 14 days of culture. The addition of conditioned medium from cultures of CD146+ marrow fibroblasts resulted in a 700-fold increase in total cell number and a 90-fold increase in erythroid cell number. This novel CD34+ cell derived erythroid island may serve as a platform to explore the molecular basis of red cell maturation and production under normal, stress and pathological conditions.


Conflict of interest statement

C.A.B. is named as an inventor on a patent for the CGS technology licensed to Ariad Pharmaceuticals, Inc. through the University of Washington. All other authors declare no competing financial interests. We would like to bring to your attention that, all authors declare no competing interests as the patent related to one author described in the original submission have expired.

Figures
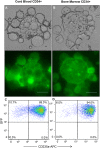
Fig 1
Fig 1. CD34+ cells derived in vitro erythroid islands.
Cord blood and bone marrow CD34+ cells were transduced with Lentiviral vectors encoding the cell growth switch (CGS) and expanded in IMDM/10% FBS in the presence of 100 nM AP20187. At day 14 cells were collected gently, spun onto glass slides and imaged by bright filed and fluorescence microscopy. (A) Cord blood and (B) bone marrow CD34+ cell derived erythroid islands are shown, an aliquot of the collected cells was treated with EDTA to prepare a single cell population for flow analysis. Representative flow cytometry profiles demonstrating the CGS expanded (GFP+) and erythroid (CD235a) expression pattern of (C) cord blood and (D) bone marrow CD34+ cells is presented (Scale bar 50 μm).
Fig 2
Fig 2. Representative snapshots showing a macrophage actively dividing and joining a tetrad of erythroblasts.
(A) Time lapse sequence showing macrophage actively dividing in CGS culture without the addition of exogenous cytokine and (B) a macrophage actively joining a tetrad of CGS expanded erythroblasts.
Fig 3
Fig 3. Cell growth switch expansion of cord blood CD34+ cells lead to terminal erythroid differentiation.
Cord blood CD34+ cells were expanded with the CGS in the presence of 100 nM AP20187. At day 14 cells were fixed in suite and electron microscopic studies revealed (A) a patterned direct association of erythroblasts around a central macrophage with processes extended towards erythroblasts, (B) Wright-Geimsa stained slides show a macrophage with multiple engulfed nuclei and enucleated red blood cell (see arrows) (40 x objective). (C) Flow cytometry analysis show α4-Integrin (low) and Band 3 (high) erythroid cells typical of the orthochromatic stage of erythroid differentiation. (D) Morphology of flow sorted (CD235a+), Wright-Geimsa stained orthochromatic normoblasts with minimal enucleation (arrow) is presented (Scale bar 50 μm).
Fig 4
Fig 4. Erythroid macrophage co-cultures yield maximum expansion.
Cord blood CD34+ cells were expanded with the CGS in the presence of 100 nM AP20187. (A) At day 7 of culture erythroid cells and macrophages were flow sorted based on CD235a and CD206 expression respectively. Morphology of sorted erythroid and macrophages was confirmed by cytospin and Wright-Giemsa staining. (B) Sorted erythroid and macrophages were cultured as erythroid alone macrophage alone and mixed (9 part erythroid and 1 part macrophage), at equal cell total densities. (C) Total macrophage number was monitored over time in mixed culture based on CD206 expression (Scale bar 25 μm).
Fig 5
Fig 5. Erythroid island associated gene expression.
Macrophages from day 14 CGS expanded cord blood CD34+ cells culture were flow sorted based on CD206 expression and control unmanipulated cord blood monocytes separated by CD14 immunomagnetic beads. Whole genome transcriptome analysis was conducted using Illumina HumanHT-12 v4 Expression assay. Selected genes are presented that are known to be associated with erythroid island niche. The 75th percentile of the negative control probes was used to define the cutoff value of log 7 signal intensity. Genes that are at or below this level are in the 'noise'. The ACTB house keeping gene is included as a reference and the average of three experiments is presented.
Fig 6
Fig 6. Cell Growth Switch transduced G-CSF-mobilized CD34+ cells do not form in vitro erythroid islands.
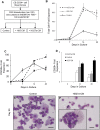
Cord blood, bone marrow and G-CSF-mobilized CD34+ cells were expanded using the CGS in the presence of 100 nM AP20187. CD14 monocytes from health donor was added to the G-CSF-mobilized culture. Representative Wright-Giemsa stained images of (A) cord blood CD34+ cells, (B) bone marrow CD34+ cells and G-CSF-mobilized peripheral blood CD34+ cells (C) without exogenous monocytes and (D) with addition of 15% marrow derived monocytes are shown. The corresponding flow cytometric histograms demonstrate immunofluorescence staining pattern of the macrophage marker CD206 in (E) cord blood (F) bone marrow and (G) G-CSF-mobilized CD34+ cells. Comparisons of fold expansion of (H) erythroid (CD235a+) and (I) absolute macrophage (CD206+) cell number in bone marrow CD34+ and G-CSF-mobilized CD34+ cells is presented. Fold expansion is relative to starting cell number and data is from two independent donors (scale bar 25 μm).
Fig 7
Fig 7. Bone marrow fibroblast conditioned medium enhance island associated erythropoiesis.
(A) Schematics of experimental design to test the effect of CD146+ (HS27a) and CD146- (HS5) bone marrow fibroblast conditioned medium on CGS based expansion of cord blood CD34+ cells. Cell aliquots were harvested at the indicated time points counted and analyzed by flow cytometry and are reported as fold-expansion based on the starting cell number. The fold change of (B) total, (C) erythroid (CD235a+) and (D) macrophage (CD206+) cell number in HS27a, HS5 and control no conditioned medium treatment is presented. Representative images of Wright-Giemsa stained cytospins from day 20 expansion products are shown in panels (E) control and (F) with HS27a-CM treatment. Inset in panel (F) indicate a macrophage with multiple engulfed nuclei. Data represent the mean ± SE from three independent experiments using three cord blood donors. P values are based on the t test (scale bar 25 μm).
Fig 8
Fig 8. Quantification of secreted proteins.
The level of secreted proteins in culture supernatant was measured by enzyme-linked immunosorbent assay. Proteins secreted at (A) 300–8000 pg/ml and (B) lower than 300 pg/ml are indicated. The control is a culture supernatant from CGS expanded cord blood CD34+ cells alone. Conditioned medium was harvested from a starting cell number of 2 x10⁶/ml HS5 and HS27a marrow fibroblast. Mean of three independent measurements are presented. ** less than the lowest detection limit of the assay.

Similar articles

Cited by

References

    1. Palis J. Primitive and definitive erythropoiesis in mammals. Front Physiol. 2014;5:3 Epub 2014/01/31. 10.3389/fphys.2014.00003 - DOI - PMC - PubMed
    1. Bessis M. Erythroblastic island, functional unity of bone marrow [French]. Revue d'Hématologie. 1958;13(1):11-Aug. - PubMed
    1. Allen TD, Dexter TM. Ultrastructural aspects of erythropoietic differentiation in long-term bone marrow culture. Differentiation. 1982;21(2):86–94. - PubMed
    1. Hanspal M, Smockova Y, Uong Q. Molecular identification and functional characterization of a novel protein that mediates the attachment of erythroblasts to macrophages. Blood. 1998;92(8):2940–50. - PubMed
    1. de Back DZ, Kostova EB, van Kraaij M, van den Berg TK, van Bruggen R. Of macrophages and red blood cells. a complex love story (Review). Frontiers in Physiology. 2014;5:9 10.3389/fphys.2014.00009 - DOI - PMC - PubMed

MeSH terms

Substances