Early BCR-ABL1 Transcript Decline after 1 Month of Tyrosine Kinase Inhibitor Therapy as an Indicator for Treatment Response in Chronic Myeloid Leukemia
- PMID: 28135325
- PMCID: PMC5279791
- DOI: 10.1371/journal.pone.0171041
Early BCR-ABL1 Transcript Decline after 1 Month of Tyrosine Kinase Inhibitor Therapy as an Indicator for Treatment Response in Chronic Myeloid Leukemia
Abstract
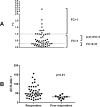
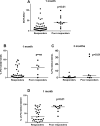
In chronic myeloid leukemia (CML), early treatment prediction is important to identify patients with inferior overall outcomes. We examined the feasibility of using reductions in BCR-ABL1 transcript levels after 1 month of tyrosine kinase inhibitor (TKI) treatment to predict therapy response. Fifty-two first-line TKI-treated CML patients were included (imatinib n = 26, dasatinib n = 21, nilotinib n = 5), and BCR-ABL1 transcript levels were measured at diagnosis (dg) and 1, 3, 6, 12, 18, 24, and 36 months. The fold change of the BCR-ABL1 transcripts at 1 month compared to initial BCR-ABL1 transcript levels was used to indicate early therapy response. In our cohort, 21% of patients had no decrease in BCR-ABL1 transcript levels after 1 month and were classified as poor responders. Surprisingly, these patients had lower BCR-ABL1 transcript levels at dg compared to responders (31% vs. 48%, p = 0.0083). Poor responders also significantly more often had enlarged spleen (55% vs. 15%; p<0.01) and a higher percentage of Ph+ CD34+CD38- cells in the bone marrow (91% vs. 75%, p<0.05). The major molecular response rates were inferior in the poor responders (at 12m 18% vs. 64%, p<0.01; 18m 27% vs. 75%, p<0.01; 24m 55% vs. 87%, p<0.01). In conclusion, early treatment response analysis defines a biologically distinct patient subgroup with inferior long-term outcomes.
Conflict of interest statement
SM and KP have received honoraria and research funding from Novartis, Bristol-Myers Squibb, and Pfizer. SM has received research funding from Ariad. HHH has received honoraria from Novartis, Bristol-Myers Squibb and Ariad. JR has received honoraria and research funding from Novartis and Bristol-Myers Squibb. NCMLSG has received research funding from Bristol-Myers Squibb for the NordCML006 study. This does not alter our adherence to PLOS ONE policies on sharing data and materials.
Figures


Similar articles
-
Early BCR-ABL1 Reduction Is Predictive of Better Event-free Survival in Patients With Newly Diagnosed Chronic Myeloid Leukemia Treated With Any Tyrosine Kinase Inhibitor.Clin Lymphoma Myeloma Leuk. 2016 Aug;16 Suppl:S96-S100. doi: 10.1016/j.clml.2016.03.008. Epub 2016 Apr 1. Clin Lymphoma Myeloma Leuk. 2016. PMID: 27131622 Review.
-
Expression of LYN and PTEN genes in chronic myeloid leukemia and their importance in therapeutic strategy.Blood Cells Mol Dis. 2014 Feb-Mar;52(2-3):121-5. doi: 10.1016/j.bcmd.2013.09.002. Epub 2013 Oct 3. Blood Cells Mol Dis. 2014. PMID: 24091144
-
Clinical Implications of Discordant Early Molecular Responses in CML Patients Treated with Imatinib.Int J Mol Sci. 2019 May 6;20(9):2226. doi: 10.3390/ijms20092226. Int J Mol Sci. 2019. PMID: 31064152 Free PMC article.
-
In chronic myeloid leukemia patients on second-line tyrosine kinase inhibitor therapy, deep sequencing of BCR-ABL1 at the time of warning may allow sensitive detection of emerging drug-resistant mutants.BMC Cancer. 2016 Aug 2;16:572. doi: 10.1186/s12885-016-2635-0. BMC Cancer. 2016. PMID: 27485109 Free PMC article.
-
The impact of BCR-ABL1 transcript type on tyrosine kinase inhibitor responses and outcomes in patients with chronic myeloid leukemia.Cancer. 2018 Oct 1;124(19):3806-3818. doi: 10.1002/cncr.31408. Epub 2018 Apr 25. Cancer. 2018. PMID: 29694669
Cited by
-
Treatment and monitoring of Philadelphia chromosome-positive leukemia patients: recent advances and remaining challenges.J Hematol Oncol. 2019 Apr 23;12(1):39. doi: 10.1186/s13045-019-0729-2. J Hematol Oncol. 2019. PMID: 31014376 Free PMC article. Review.
-
Monitoring of Minimal Residual Disease (MRD) in Chronic Myeloid Leukemia: Recent Advances.Cancer Manag Res. 2020 May 6;12:3175-3189. doi: 10.2147/CMAR.S232752. eCollection 2020. Cancer Manag Res. 2020. PMID: 32440215 Free PMC article. Review.
-
BCR-ABL1 transcript levels at 4 weeks have prognostic significance for time-specific responses and for predicting survival in chronic-phase chronic myeloid leukemia patients treated with various tyrosine kinase inhibitors.Cancer Med. 2018 Oct;7(10):5107-5117. doi: 10.1002/cam4.1753. Epub 2018 Aug 31. Cancer Med. 2018. PMID: 30171671 Free PMC article.
-
Early BCR-ABL1 decline in imatinib-treated patients with chronic myeloid leukemia: results from a multicenter study of the Chinese CML alliance.Blood Cancer J. 2018 Jun 15;8(7):61. doi: 10.1038/s41408-018-0093-4. Blood Cancer J. 2018. PMID: 29915172 Free PMC article.
References
-
- Hoffbrand AV. Postgraduate hematology. 6th ed. 2011.
MeSH terms
Substances
LinkOut - more resources
Full Text Sources
Other Literature Sources
Medical
Research Materials
Miscellaneous

