. 2017 Jan 30;12(1):e0171053.
doi: 10.1371/journal.pone.0171053. eCollection 2017.

Genotyping-by-Sequencing in a Species Complex of Australian Hummock Grasses (Triodia): Methodological Insights and Phylogenetic Resolution

Affiliations

Genotyping-by-Sequencing in a Species Complex of Australian Hummock Grasses (Triodia): Methodological Insights and Phylogenetic Resolution

Benjamin M Anderson et al. PLoS One. .

Abstract

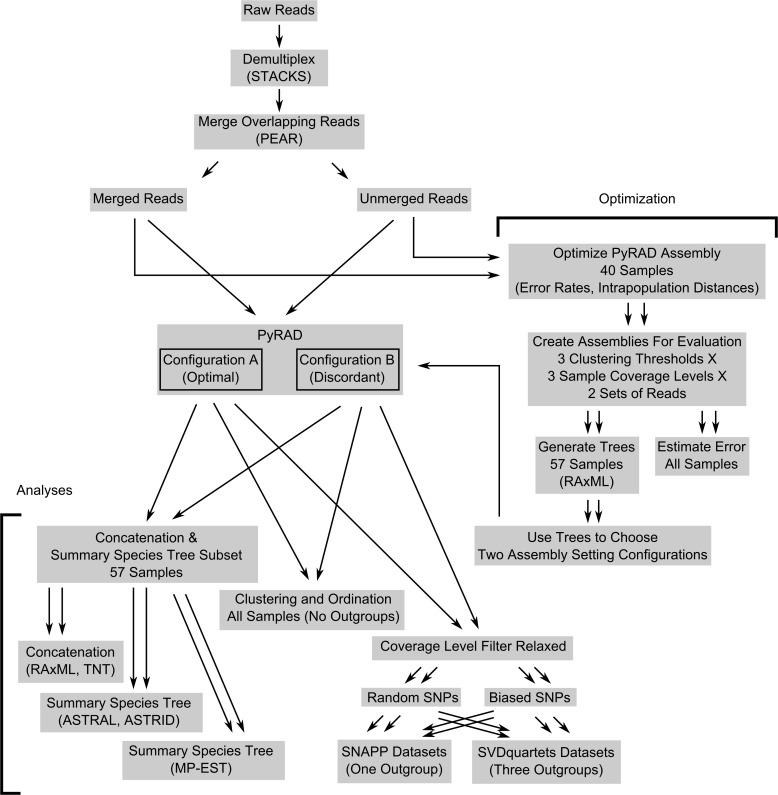
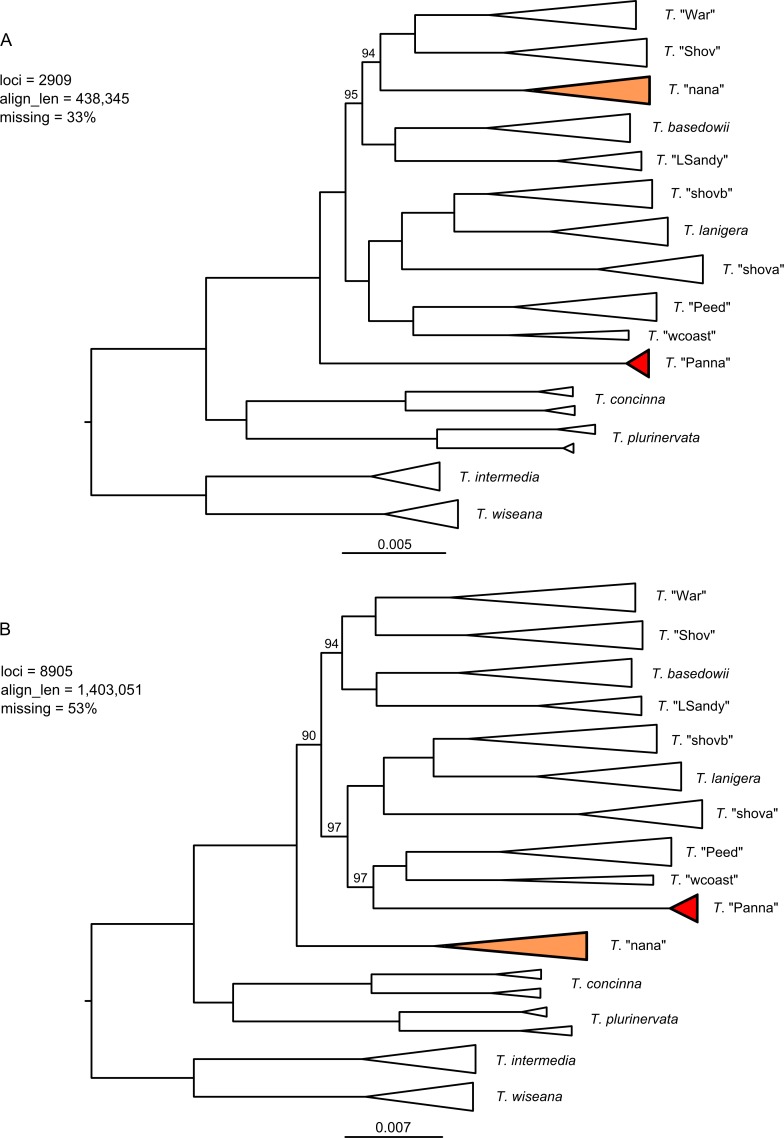
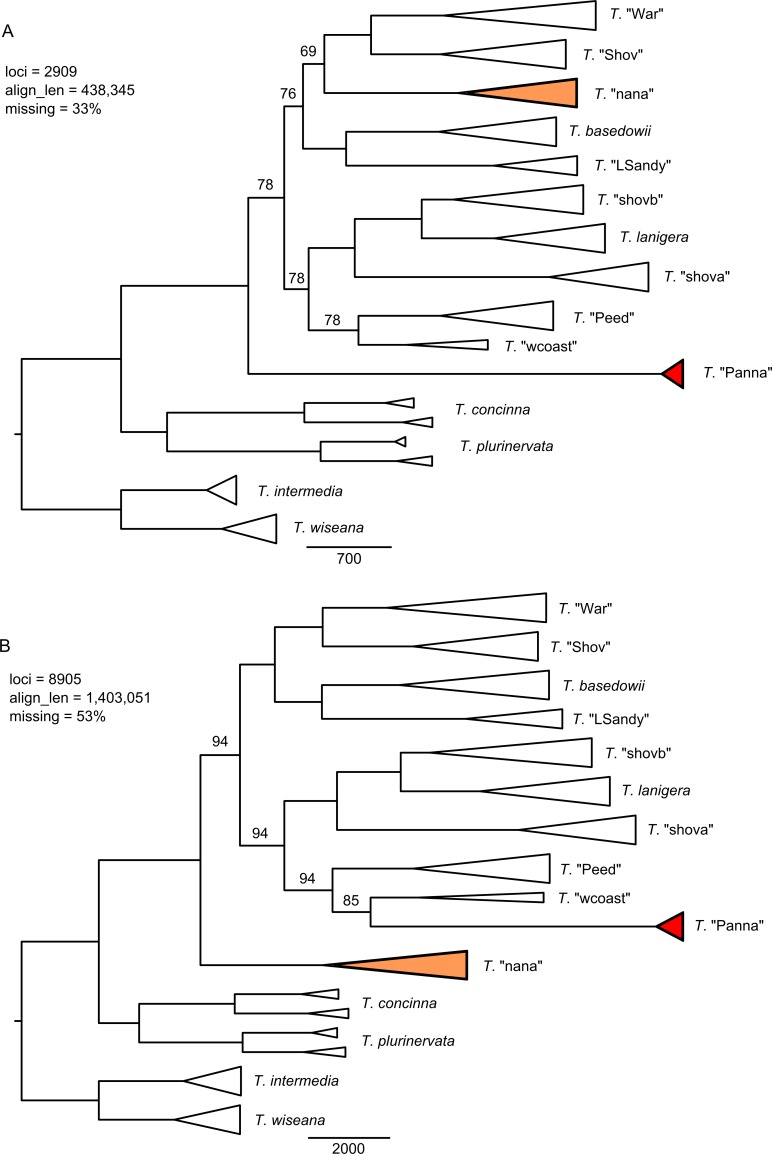
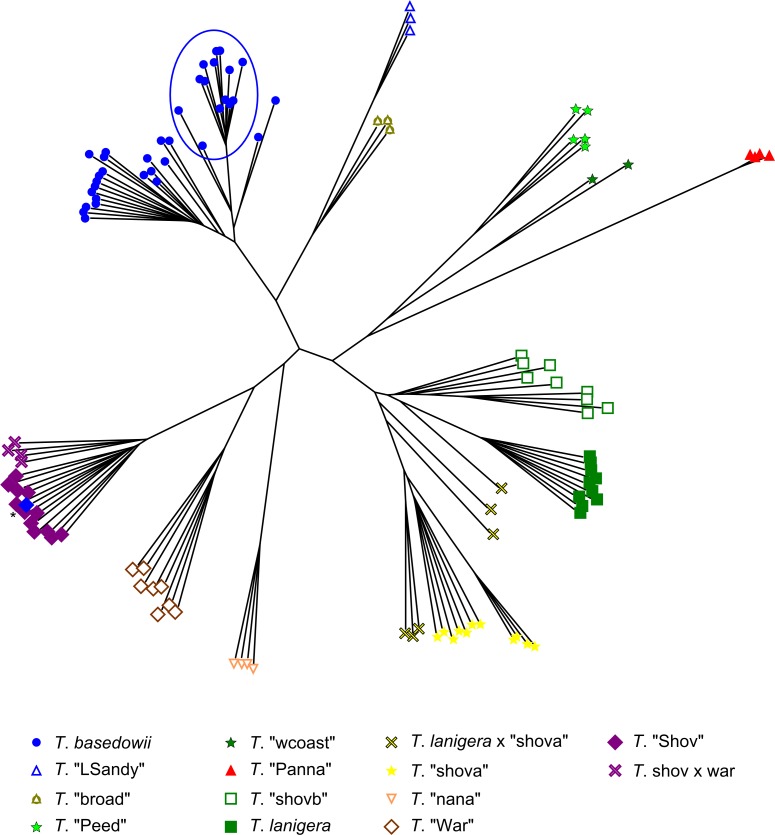
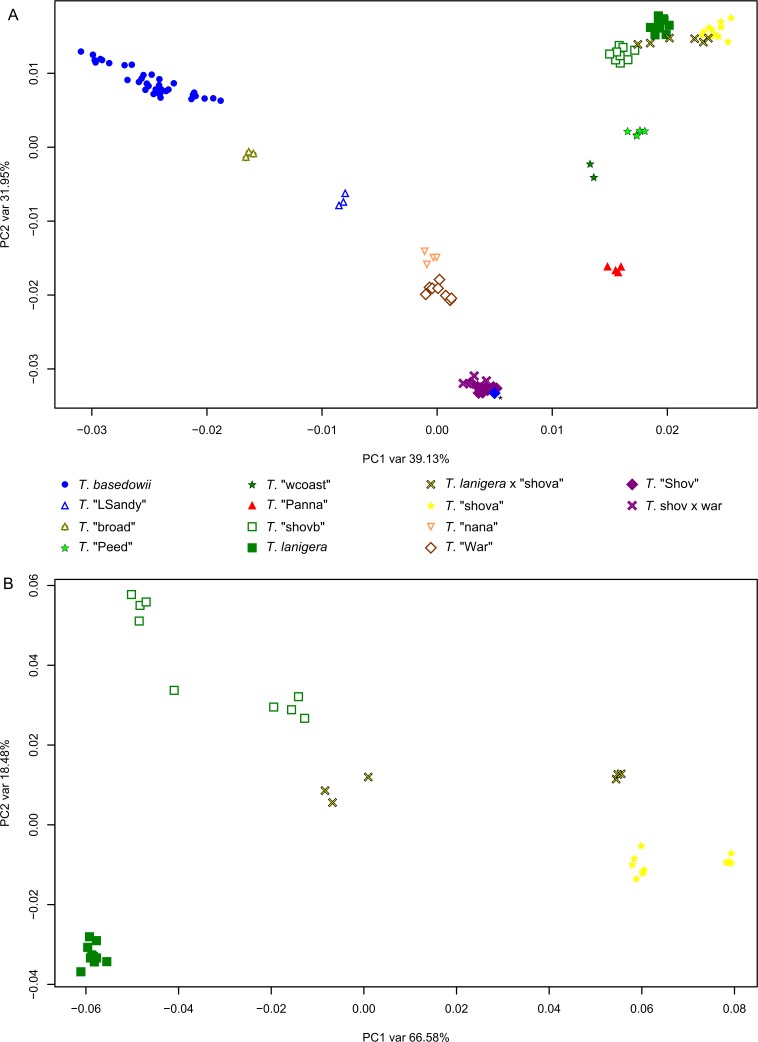
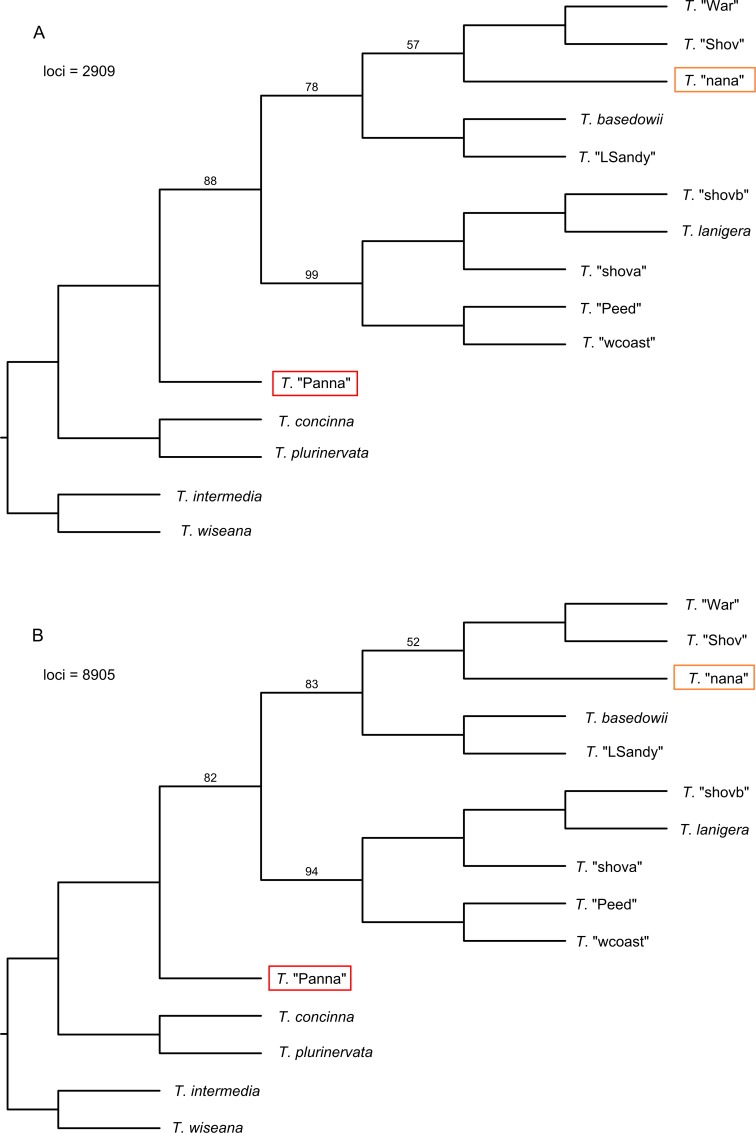
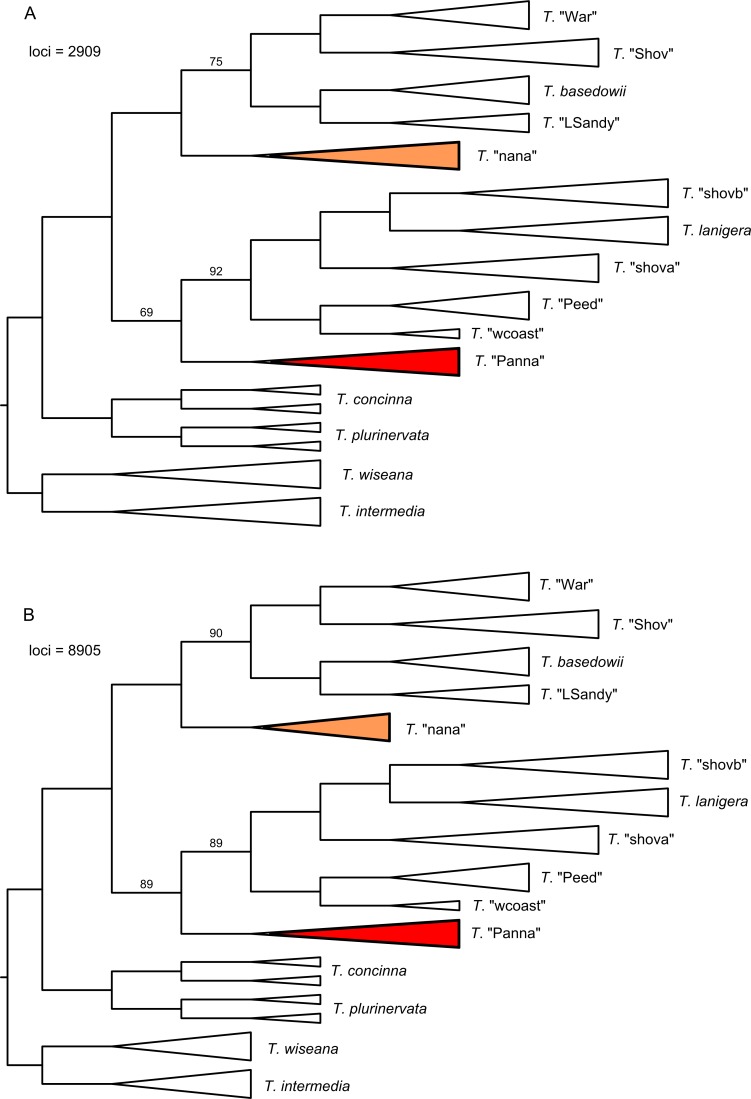
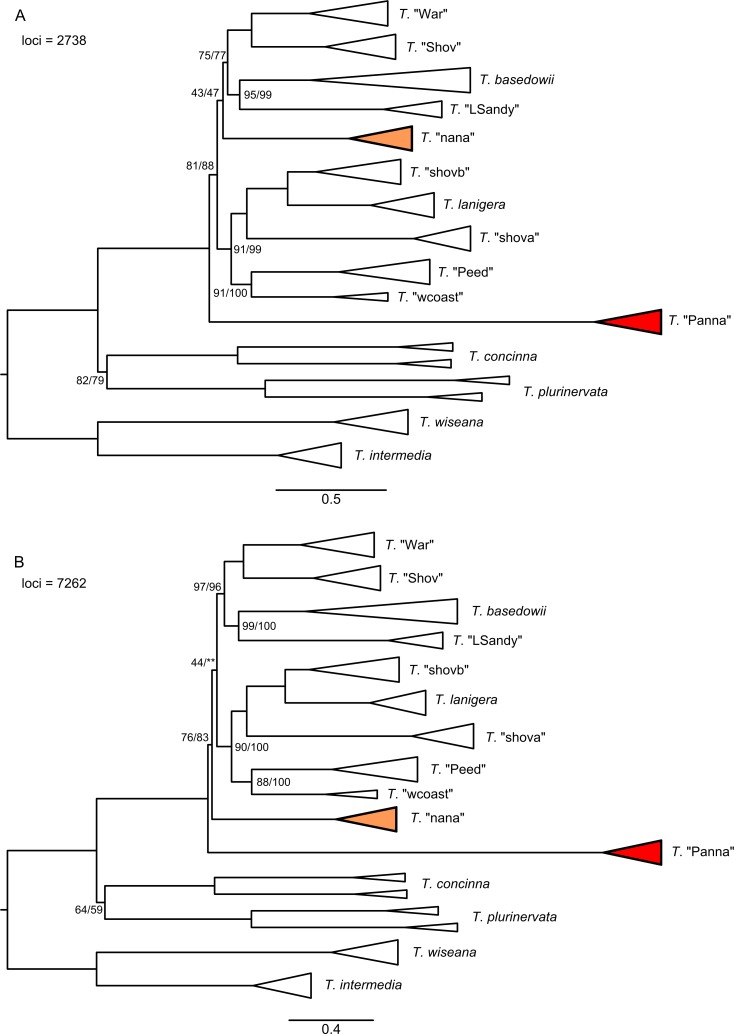
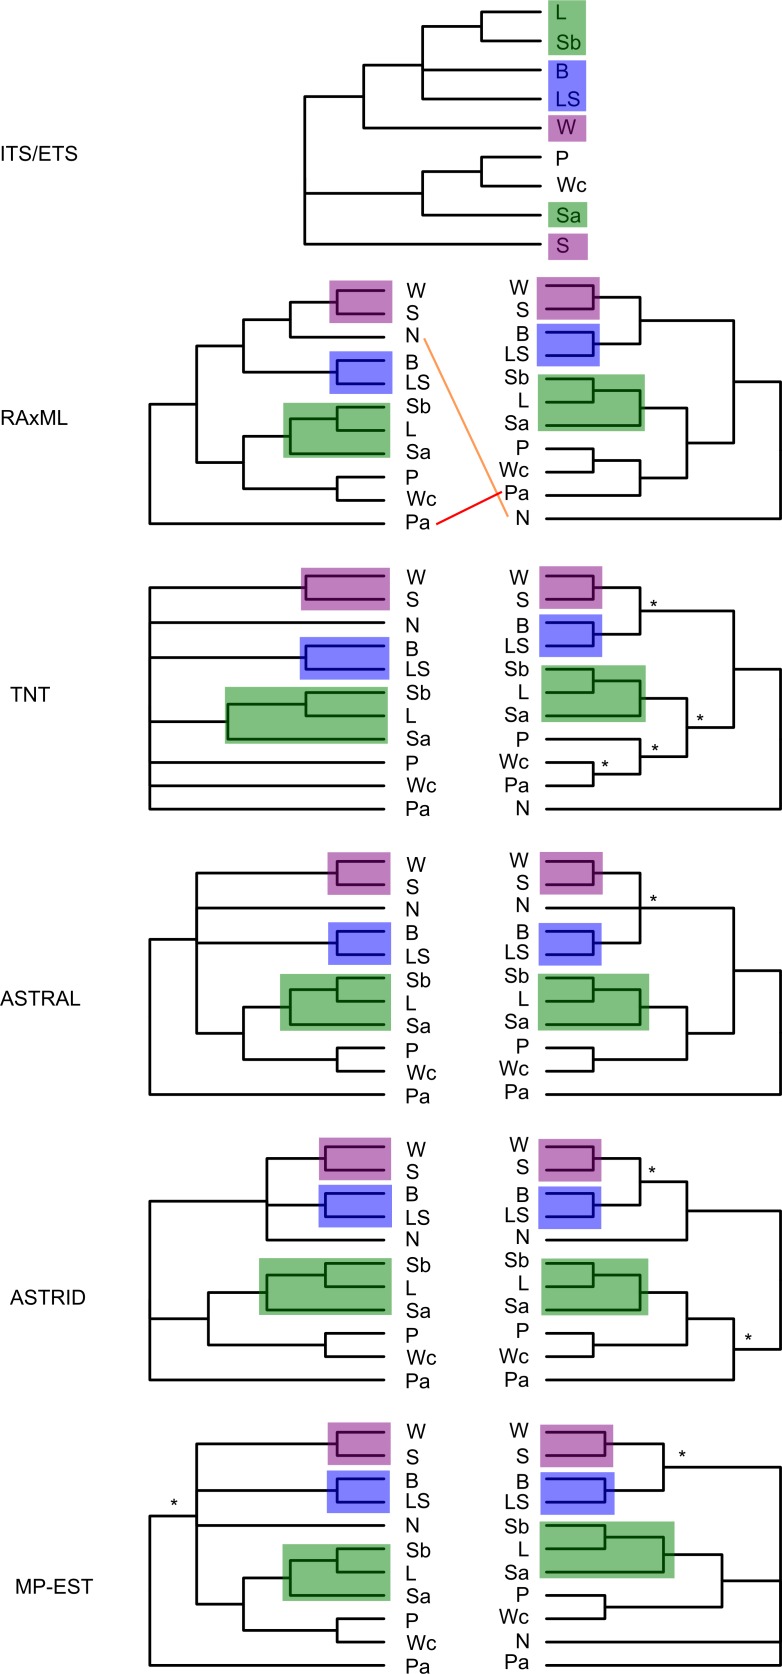
Next-generation sequencing is becoming increasingly accessible to researchers asking biosystematic questions, but current best practice in both choosing a specific approach and effectively analysing the resulting data set is still being explored. We present a case study for the use of genotyping-by-sequencing (GBS) to resolve relationships in a species complex of Australian arid and semi-arid grasses (Triodia R.Br.), highlighting our solutions to methodological challenges in the use of GBS data. We merged overlapping paired-end reads then optimised locus assembly in the program PyRAD to generate GBS data sets for phylogenetic and distance-based analyses. In addition to traditional concatenation analyses in RAxML, we also demonstrate the novel use of summary species tree analyses (taking gene trees as input) with GBS loci. We found that while species tree analyses were relatively robust to variation in PyRAD assembly parameters, our RAxML analyses resulted in well-supported but conflicting topologies under different assembly settings. Despite this conflict, multiple clades in the complex were consistently supported as distinct across analyses. Our GBS data assembly and analyses improve the resolution of taxa and phylogenetic relationships in the Triodia basedowii complex compared to our previous study based on Sanger sequencing of nuclear (ITS/ETS) and chloroplast (rps16-trnK spacer) markers. The genomic results also partly support previous evidence for hybridization between species in the complex. Our methodological insights for analysing GBS data will assist researchers using similar data to resolve phylogenetic relationships within species complexes.


Conflict of interest statement

The authors have declared that no competing interests exist.

Figures

Fig 1
Fig 1. Sampling locations for populations from the Triodia basedowii complex and close relatives.
The outgroups T. concinna and T. plurinervata are included. Elevation base map information from [48].
Fig 2
Fig 2. Schematic of bioinformatic and analytical steps presented in this study.
Fig 3
Fig 3. RAxML trees for the combined data set and two assemblies.
A) 0.88/0.91 (merged/unmerged) clustering threshold, 50% minimum taxon coverage; B) 0.88/0.82 clustering threshold, 25% minimum taxon coverage. Support values from 100 bootstrap replicates are only shown for branches with <100% support. Scale bar units are RAxML branch lengths.
Fig 4
Fig 4. TNT maximum parsimony trees for the combined data set and two assemblies.
A) 0.88/0.91 (merged/unmerged) clustering threshold, 50% minimum taxon coverage; B) 0.88/0.82 clustering threshold, 25% minimum taxon coverage. Support values from 100 bootstrap replicates are only shown for branches with <100% support. Scale bar units are differences.
Fig 5
Fig 5. Neighbour-joining tree for samples from the Triodia basedowii complex.
Distances are based on 119,449 SNPs, after filtering for 50% minimum taxon coverage and removing invariant SNPs. T. basedowii populations from central Australia are circled. The asterisked sample (blue diamond) was likely mislabelled as T. basedowii in the field (co-occurring with T. "Shov") and is probably a T. "Shov" sample.
Fig 6
Fig 6. Principal coordinates analysis of samples from the Triodia basedowii complex.
A) all samples, using 119,449 SNPs following filtering for 50% minimum taxon coverage and removing invariant SNPs; B) samples of T. lanigera, T. "shovb", T. "shova" and putative hybrids between them, using 44,365 SNPs after filtering as in A. The asterisked sample is likely mislabelled as T. basedowii (co-occurring).
Fig 7
Fig 7. ASTRAL trees for the combined data set and two assemblies.
A) 0.88/0.91 (merged/unmerged) clustering threshold, 50% minimum taxon coverage; B) 0.88/0.82 clustering threshold, 25% minimum taxon coverage. Support values from 100 multi-locus bootstrap replicates are only shown for branches with <100% support. Branch lengths are meaningless.
Fig 8
Fig 8. ASTRID trees for the combined data set and two assemblies.
A) 0.88/0.91 (merged/unmerged) clustering threshold, 50% minimum taxon coverage; B) 0.88/0.82 clustering threshold, 25% minimum taxon coverage. Support values from 100 multi-locus bootstrap replicates are only shown for branches with <100% support. Branch lengths are meaningless.
Fig 9
Fig 9. MP-EST trees (samples as species) for the combined data set and two assemblies.
A) 0.88/0.91 (merged/unmerged) clustering threshold, 50% minimum taxon coverage; B) 0.88/0.82 clustering threshold, 25% minimum taxon coverage. Scale bars are in coalescent units. Terminal branch lengths are not estimated, so the length of collapsed groups (triangles) is not reliable. All shown branch lengths are estimated by MP-EST. Support values from 100 multi-locus bootstrap replicates are only shown for branches with <100% support, for both analyses (samples as species / groups of samples as species). **In the analysis with groups of samples as species, T. "nana" grouped with the top four taxa (as in A) with 46% support.
Fig 10
Fig 10. Topologies for the Triodia basedowii complex across analyses for two assemblies.
0.88/0.91 (merged/unmerged) clustering threshold, 50% minimum taxon coverage (left) and 0.88/0.82 clustering threshold, 25% minimum taxon coverage (right). Branches with less than 80% support are collapsed. Asterisks designate clades not present in the alternate assembly. Clades consistent across analyses are highlighted. B: T. basedowii, L: T. lanigera, LS: T. "LSandy", N: T. "nana", P: T. "Peed", Pa: T. "Panna", S: T. "Shov", Sa: T. "shova", Sb: T. "shovb", W: T. "War", Wc: T. "wcoast". ITS/ETS results are from Anderson et al. [46].

References

    1. McCormack JE, Hird SM, Zellmer AJ, Carstens BC, Brumfield RT. Applications of next-generation sequencing to phylogeography and phylogenetics. Mol. Phylogenet. Evol. 2013;66:526–38. 10.1016/j.ympev.2011.12.007 - DOI - PubMed
    1. Bryant D, Bouckaert R, Felsenstein J, Rosenberg NA, RoyChoudhury A. Inferring species trees directly from biallelic genetic markers: bypassing gene trees in a full coalescent analysis. Mol. Biol. Evol. 2012;29:1917–32. 10.1093/molbev/mss086 - DOI - PMC - PubMed
    1. Rubin BER, Ree RH, Moreau CS. Inferring phylogenies from RAD sequence data. PLoS ONE 2012;7:e33394 10.1371/journal.pone.0033394 - DOI - PMC - PubMed
    1. Huang H, Knowles LL. Unforeseen consequences of excluding missing data from next-generation sequences: simulation study of RAD sequences. Syst. Biol. 2016;65:357–65. 10.1093/sysbio/syu046 - DOI - PubMed
    1. Leaché AD, Banbury BL, Felsenstein J, Nieto-Montes de Oca A, Stamatakis A. Short tree, long tree, right tree, wrong tree: new acquisition bias corrections for inferring SNP phylogenies. Syst. Biol. 2015;64:1032–47. 10.1093/sysbio/syv053 - DOI - PMC - PubMed

Substances

LinkOut - more resources