

Multidisciplinary insight into clonal expansion of HTLV-1-infected cells in adult T-cell leukemia via modeling by deterministic finite automata coupled with high-throughput sequencing
- PMID: 28137248
- PMCID: PMC5282739
- DOI: 10.1186/s12920-016-0241-2
Multidisciplinary insight into clonal expansion of HTLV-1-infected cells in adult T-cell leukemia via modeling by deterministic finite automata coupled with high-throughput sequencing
Abstract
Background: Clonal expansion of leukemic cells leads to onset of adult T-cell leukemia (ATL), an aggressive lymphoid malignancy with a very poor prognosis. Infection with human T-cell leukemia virus type-1 (HTLV-1) is the direct cause of ATL onset, and integration of HTLV-1 into the human genome is essential for clonal expansion of leukemic cells. Therefore, monitoring clonal expansion of HTLV-1-infected cells via isolation of integration sites assists in analyzing infected individuals from early infection to the final stage of ATL development. However, because of the complex nature of clonal expansion, the underlying mechanisms have yet to be clarified. Combining computational/mathematical modeling with experimental and clinical data of integration site-based clonality analysis derived from next generation sequencing technologies provides an appropriate strategy to achieve a better understanding of ATL development.
Methods: As a comprehensively interdisciplinary project, this study combined three main aspects: wet laboratory experiments, in silico analysis and empirical modeling.
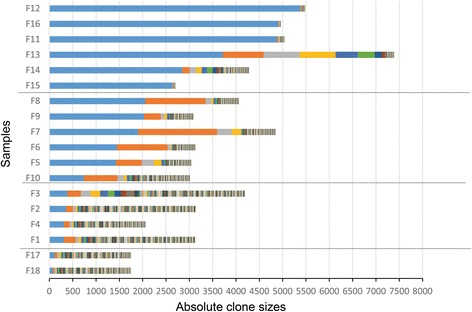
Results: We analyzed clinical samples from HTLV-1-infected individuals with a broad range of proviral loads using a high-throughput methodology that enables isolation of HTLV-1 integration sites and accurate measurement of the size of infected clones. We categorized clones into four size groups, "very small", "small", "big", and "very big", based on the patterns of clonal growth and observed clone sizes. We propose an empirical formal model based on deterministic finite state automata (DFA) analysis of real clinical samples to illustrate patterns of clonal expansion.
Conclusions: Through the developed model, we have translated biological data of clonal expansion into the formal language of mathematics and represented the observed clonality data with DFA. Our data suggest that combining experimental data (absolute size of clones) with DFA can describe the clonality status of patients. This kind of modeling provides a basic understanding as well as a unique perspective for clarifying the mechanisms of clonal expansion in ATL.
Keywords: Adult T-cell leukemia; Clonal expansion; Deterministic finite state automata (DFA); Human T-cell leukemia virus ype-1; Integration site; Mathematical computational modeling; Next-generation sequencing; State-transition diagram.
Figures


Similar articles
-
Clonality of HTLV-1-infected T cells as a risk indicator for development and progression of adult T-cell leukemia.Blood Adv. 2017 Jun 27;1(15):1195-1205. doi: 10.1182/bloodadvances.2017005900. eCollection 2017 Jun 27. Blood Adv. 2017. PMID: 29296760 Free PMC article.
-
Inferring clonal structure in HTLV-1-infected individuals: towards bridging the gap between analysis and visualization.Hum Genomics. 2017 Jul 11;11(1):15. doi: 10.1186/s40246-017-0112-8. Hum Genomics. 2017. PMID: 28697807 Free PMC article.
-
The role of HTLV-1 clonality, proviral structure, and genomic integration site in adult T-cell leukemia/lymphoma.Blood. 2014 Jun 19;123(25):3925-31. doi: 10.1182/blood-2014-02-553602. Epub 2014 Apr 15. Blood. 2014. PMID: 24735963 Free PMC article.
-
Adult T-cell leukemia: molecular basis for clonal expansion and transformation of HTLV-1-infected T cells.Blood. 2017 Mar 2;129(9):1071-1081. doi: 10.1182/blood-2016-09-692574. Epub 2017 Jan 23. Blood. 2017. PMID: 28115366 Free PMC article. Review.
-
HTLV-1 clonality in adult T-cell leukaemia and non-malignant HTLV-1 infection.Semin Cancer Biol. 2014 Jun;26:89-98. doi: 10.1016/j.semcancer.2013.11.003. Epub 2013 Dec 6. Semin Cancer Biol. 2014. PMID: 24316494 Free PMC article. Review.
Cited by
-
Mutational Intratumor Heterogeneity is a Complex and Early Event in the Development of Adult T-cell Leukemia/Lymphoma.Neoplasia. 2018 Sep;20(9):883-893. doi: 10.1016/j.neo.2018.07.001. Epub 2018 Jul 19. Neoplasia. 2018. PMID: 30032036 Free PMC article.
-
A novel hybrid method with convergence analysis for approximation of HTLV-I dynamics model.Sci Rep. 2024 Oct 27;14(1):25678. doi: 10.1038/s41598-024-76110-9. Sci Rep. 2024. PMID: 39465268 Free PMC article.
-
Clonality of HTLV-1-infected T cells as a risk indicator for development and progression of adult T-cell leukemia.Blood Adv. 2017 Jun 27;1(15):1195-1205. doi: 10.1182/bloodadvances.2017005900. eCollection 2017 Jun 27. Blood Adv. 2017. PMID: 29296760 Free PMC article.
-
An Improved Sequencing-Based Bioinformatics Pipeline to Track the Distribution and Clonal Architecture of Proviral Integration Sites.Front Microbiol. 2020 Oct 20;11:587306. doi: 10.3389/fmicb.2020.587306. eCollection 2020. Front Microbiol. 2020. PMID: 33193242 Free PMC article.
-
RNA sequencing identifies clonal structure of T-cell repertoires in patients with adult T-cell leukemia/lymphoma.NPJ Genom Med. 2019 May 6;4:10. doi: 10.1038/s41525-019-0084-9. eCollection 2019. NPJ Genom Med. 2019. PMID: 31069115 Free PMC article.
References
-
- Greaves M. Evolutionary determinants of cancer. Cancer Discov. 2015;5(8):806–820. doi: 10.1158/2159-8290.CD-15-0439. - DOI - PMC - PubMed
Publication types
MeSH terms
LinkOut - more resources
Full Text Sources
Other Literature Sources
Research Materials
