. 2017 Jan 31;18(1):116.
doi: 10.1186/s12864-017-3514-z.

Epithelial response to a high-protein diet in rat colon

Affiliations

Epithelial response to a high-protein diet in rat colon

Martin Beaumont et al. BMC Genomics. .

Abstract

Background: High-protein diets (HPD) alter the large intestine microbiota composition in association with a metabolic shift towards protein degradation. Some amino acid-derived metabolites produced by the colon bacteria are beneficial for the mucosa while others are deleterious at high concentrations. The aim of the present work was to define the colonic epithelial response to an HPD. Transcriptome profiling was performed on colonocytes of rats fed an HPD or an isocaloric normal-protein diet (NPD) for 2 weeks.

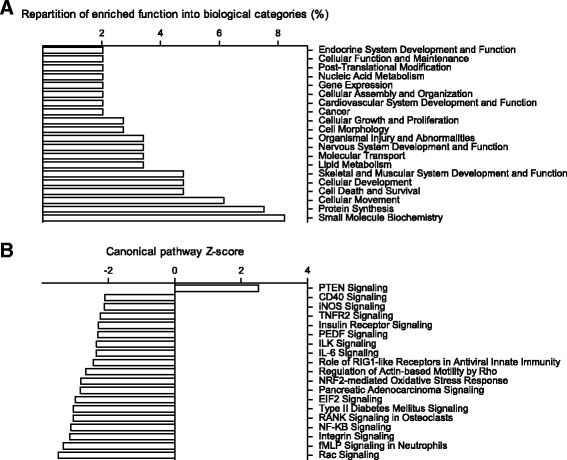
Results: The HPD downregulated the expression of genes notably implicated in pathways related to cellular metabolism, NF-κB signaling, DNA repair, glutathione metabolism and cellular adhesion in colonocytes. In contrast, the HPD upregulated the expression of genes related to cell proliferation and chemical barrier function. These changes at the mRNA level in colonocytes were not associated with detrimental effects of the HPD on DNA integrity (comet assay), epithelium renewal (quantification of proliferation and apoptosis markers by immunohistochemistry and western blot) and colonic barrier integrity (Ussing chamber experiments).

Conclusion: The modifications of the luminal environment after an HPD were associated with maintenance of the colonic homeostasis that might be the result of adaptive processes in the epithelium related to the observed transcriptional regulations.

Keywords: Barrier function; Colon; DNA damages; Dietary protein; Epithelial cells; Epithelial renewal; High-protein diet; Mucus; Transcriptome.


Figures

Fig. 1
Fig. 1
a Macroscopic aspects of colon from rats fed a normal-protein diet (NPD) or a high-protein diet (HPD). b Colonic content weight. a-b Data presented on histograms are means +/- S.E.M. Mean values were compared with a t test. ***: p < 0.001
Fig. 2
Fig. 2
Functional analysis of differentially expressed genes in colonocytes isolated from rats fed a high-protein diet (HPD) compared to a normal-protein diet was performed with Ingenuity Pathway Analysis software. a Distribution of significantly enriched functions (p < 0.05) into biological categories is presented as a percentage of the total number of enriched functions (77). b Canonical pathways significantly enriched (p < 0.05). A pathway was considered downregulated in the colonocytes of HPD-fed rats when Z-score was < -2 and upregulated when Z-score was > 2. Canonical pathways significantly enriched but not associated with a significant Z-score are not shown
Fig. 3
Fig. 3
a and b Relative expression values of a selection of significantly differentially expressed genes (q < 0.01) participating to the enriched pathways Glutathione-Mediated Detoxification (a) and DNA repair (b) in the colonocytes of rats fed a high-protein diet (HPD) compared to a normal-protein diet (NPD). The expression values were obtained by microarray experiment and normalized to the mean value in the NPD group. Gstm1, 3 and 5 (glutathione S-transferase mu 1, 3 and 5), Mgst1 (microsomal glutathione S-transferase 1), Gstt1 (glutathione S-transferase theta 1), Gsto1 (glutathione S-transferase omega 1), Nhej1 (non-homologous end-joining factor 1), Xab2 (XPA Binding Protein 2), Ddb1 (damage-specific DNA binding protein 1), Ogg1 (8-oxoguanine DNA glycosylase), Ung (uracil DNA glycosylase). c - DNA damages in colonocytes of rats fed an HPD or an NPD were assessed with the comet assay. The percentage of DNA in the tail of the comet is proportional to the amount of DNA damages in the cells. Mean values were compared with a t test. a-c Data presented are means +/- S.E.M
Fig. 4
Fig. 4
a NF-κB signaling canonical pathway diagram. This pathway was significantly enriched in the set of genes regulated by the high-protein diet (HPD). The diagram was obtained from Ingenuity Pathway Analysis software and depicts genes implicated in this pathway and their interactions. Expression of genes colored in green and red were respectively downregulated (q < 0.1) and upregulated (q < 0.1) in colonocytes of rats fed an HPD when compared to a normal-protein diet (NPD). The list of differentially expressed genes implicated in this pathway is presented in Additional file 6: Table S3. b Relative expression values of a selection of significantly differentially expressed genes (q < 0.01) participating to the NF-κB signaling pathway in the colonocytes of rats fed an HPD when compared to an NPD. The expression values were obtained by microarray experiment and normalized to the mean value in the NPD group. Nfkbie (NF-κB inhibitor epsilon), Rela (RELA proto-oncogene, NF-κB subunit), Nfkb1 and 2 (NF-κB subunit 1 and 2), Traf2 and 6 (TNF receptor associated factor 2 and 6). Data presented on histograms are means +/- S.E.M
Fig. 5
Fig. 5
a Relative expression values of a selection of significantly differentially expressed genes (q < 0.01) participating to the enriched pathway Cell death in the colonocytes of rats fed a high-protein diet (HPD) when compared to a normal-protein diet (NPD). The expression values were obtained by microarray experiment and normalized to the mean value in the NPD group. Bax (BCL2 associated X, apoptosis regulator), Ripk1 (receptor interacting serine/threonine kinase 1), Ilk (integrin linked kinase). b The expression of the apoptotic marker activated caspase 3 protein was quantified by western blot in colonocytes of rats fed an HPD or an NPD. Band intensity was quantified and normalized to the intensity of the band corresponding to actin. For each protein, mean values were compared with a t test. a-b Data presented on histograms are means +/- S.E.M
Fig. 6
Fig. 6
a Relative expression values of a selection of significantly differentially expressed genes (q < 0.01) related to proliferation in the colonocytes of rats fed a high-protein diet (HPD) when compared to a normal-protein diet (NPD). The expression values were obtained by microarray experiment and normalized to the mean value in the NPD group. Tfrc (transferrin receptor), Mt1a, 2a, 3 and 4 (metallothionein 1A, 2A, 3 and 4), Ppp2r2a (protein phosphatase 2 regulatory subunit B alpha), Ndrg1 (N-myc downstream regulated 1), Prdx1 (peroxiredoxin 1). b Staining of Ki67 by immunohistochemistry on distal colon of rats fed an NPD or an HPD. Ki67 labelling index was calculated as the percentage of Ki67 positive cells relative to the total number of cells within the same crypts. c Proliferating cell nuclear antigen (PCNA) protein expression was quantified by western blot in colonocytes of rats fed an HPD or an NPD. Band intensity was quantified and normalized to the intensity of the band corresponding to actin. b-c Mean values were compared with a t test. a-c Data presented on histograms are means +/- S.E.M
Fig. 7
Fig. 7
a Heatmap representing the expression values of mucin genes in colonocytes (Muc). Each row corresponds to one Muc gene. Each column corresponds to a single rat fed a normal-protein diet (NPD), or a high-protein diet (HPD). The color indicates the relative expression value (as indicated by the key) obtained from microarray experiment and normalized to the mean value in the NPD group. Mean expression values of the HPD and the NPD groups were compared with a t test. *: p < 0.05. b Relative expression values of defensin genes significantly differentially expressed (q < 0.01) in the colonocytes of rats fed a HPD when compared to a NPD. The expression values were obtained by microarray experiment and normalized to the mean value in the NPD group. Defb3, 4, 10, 15, 19, 22 and 30 (β-defensin 3, 4, 10, 15, 19, 22 and 30). c Claudin 1 protein expression was assessed by western blot in colonocytes of rats fed an HPD or an NPD. Band intensity was quantified and normalized to the intensity of the band corresponding to actin. e-f Barrier function was evaluated with Ussing-chambers in distal colon of rats fed an NPD or an HDP. e Transmural resistance was measured for 15 min after mucosa mounting in the chamber. f FITC-dextran (FD4) transport from mucosal to serosal side was recorded during two hours and FD4 apparent permeability (FD4 Papp) was calculated. c-e For each parameter, mean values were compared with a t test. b-e Data presented on histograms are means +/- S.E.M

References

    1. Peterson LW, Artis D. Intestinal epithelial cells: regulators of barrier function and immune homeostasis. Nat Rev Immunol. 2014;14:141–153. doi: 10.1038/nri3608. - DOI - PubMed
    1. Lee D, Albenberg L, Compher C, Baldassano R, Piccoli D, Lewis JD, et al. Diet in the pathogenesis and treatment of inflammatory bowel diseases. Gastroenterology. 2015;148:1087–1106. doi: 10.1053/j.gastro.2015.01.007. - DOI - PMC - PubMed
    1. Gibson JA, Sladen GE, Dawson AM. Protein absorption and ammonia production: the effects of dietary protein and removal of the colon. Br J Nutr. 1976;35:61–65. doi: 10.1079/BJN19760009. - DOI - PubMed
    1. Silvester KR, Cummings JH. Does digestibility of meat protein help explain large bowel cancer risk? Nutr Cancer. 1995;24:279–288. doi: 10.1080/01635589509514417. - DOI - PubMed
    1. Bax M-L, Buffière C, Hafnaoui N, Gaudichon C, Savary-Auzeloux I, Dardevet D, et al. Effects of meat cooking, and of ingested amount, on protein digestion speed and entry of residual proteins into the colon: a study in minipigs. PLoS One. 2013;8:e61252. doi: 10.1371/journal.pone.0061252. - DOI - PMC - PubMed

Publication types