

Cardiac Autonomic Regulation and Repolarization During Acute Experimental Hypoglycemia in Type 2 Diabetes
- PMID: 28137792
- PMCID: PMC5860266
- DOI: 10.2337/db16-1310
Cardiac Autonomic Regulation and Repolarization During Acute Experimental Hypoglycemia in Type 2 Diabetes
Abstract
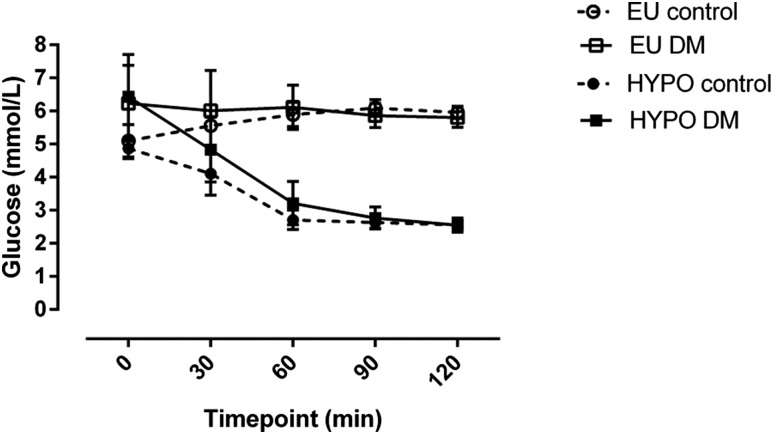
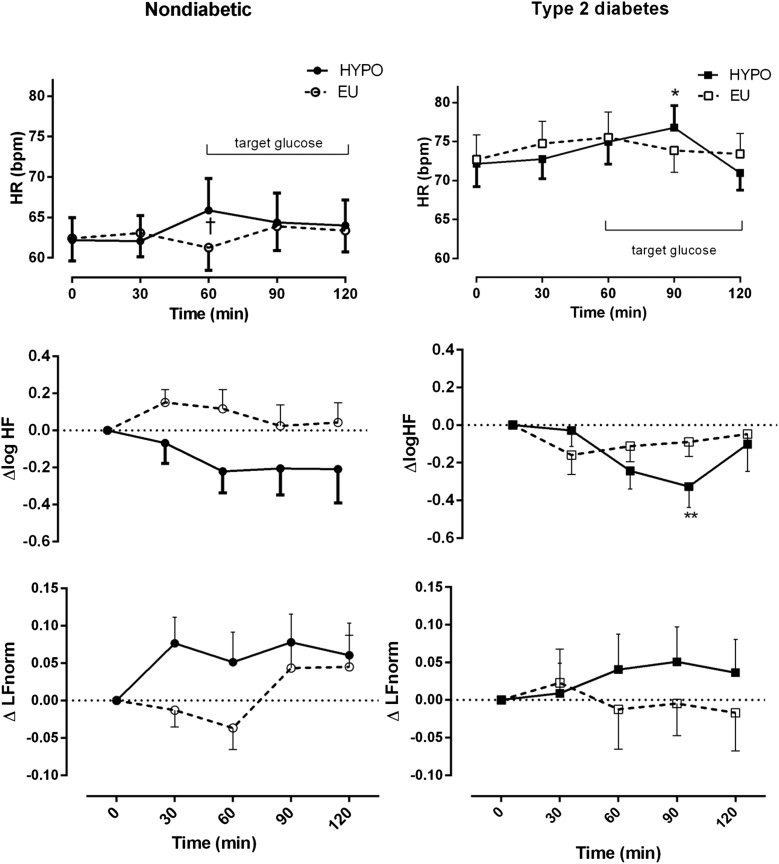
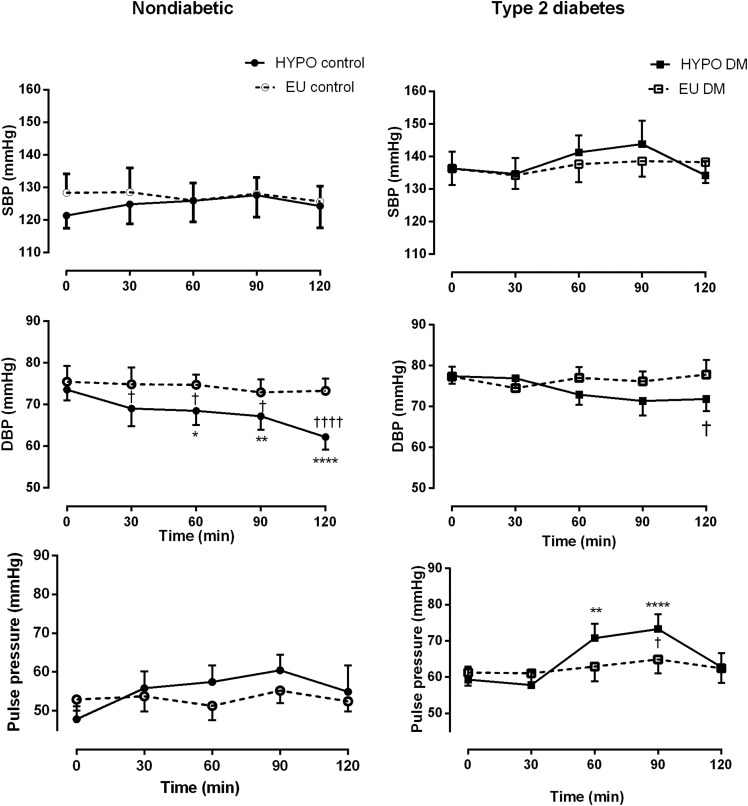
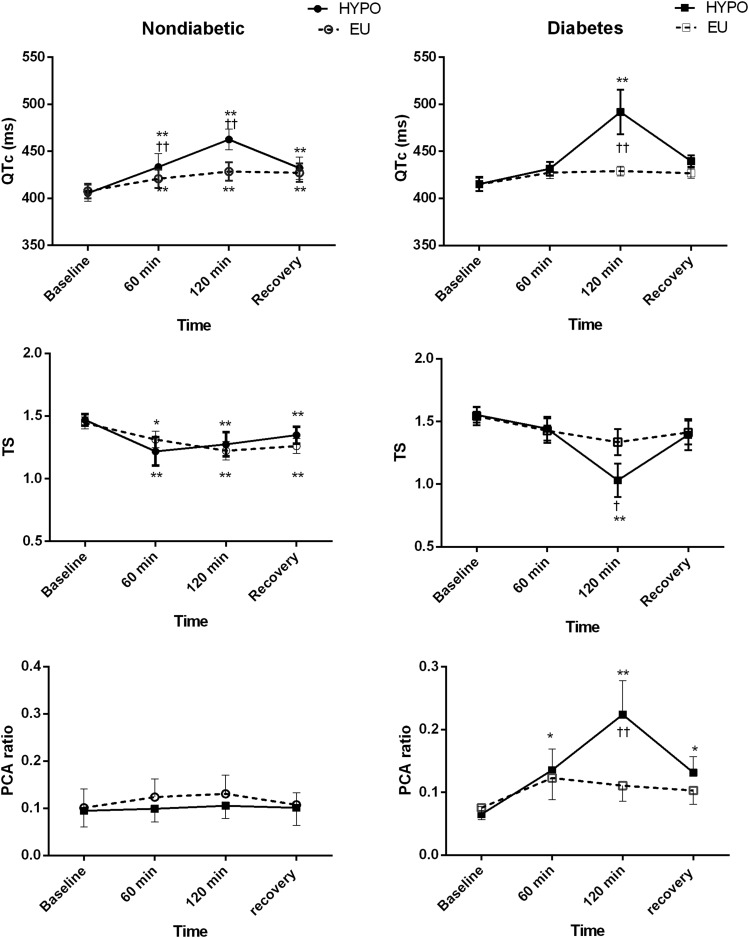
Hypoglycemia is associated with increased cardiovascular mortality in trials of intensive therapy in type 2 diabetes mellitus (T2DM). We previously observed an increase in arrhythmias during spontaneous prolonged hypoglycemia in patients with T2DM. We examined changes in cardiac autonomic function and repolarization during sustained experimental hypoglycemia. Twelve adults with T2DM and 11 age- and BMI-matched control participants without diabetes underwent paired hyperinsulinemic clamps separated by 4 weeks. Glucose was maintained at euglycemia (6.0 mmol/L) or hypoglycemia (2.5 mmol/L) for 1 h. Heart rate, blood pressure, and heart rate variability were assessed every 30 min and corrected QT intervals and T-wave morphology every 60 min. Heart rate initially increased in participants with T2DM but then fell toward baseline despite maintained hypoglycemia at 1 h accompanied by reactivation of vagal tone. In control participants, vagal tone remained depressed during sustained hypoglycemia. Participants with T2DM exhibited greater heterogeneity of repolarization during hypoglycemia as demonstrated by T-wave symmetry and principal component analysis ratio compared with control participants. Epinephrine levels during hypoglycemia were similar between groups. Cardiac autonomic regulation during hypoglycemia appears to be time dependent. Individuals with T2DM demonstrate greater repolarization abnormalities for a given hypoglycemic stimulus despite comparable sympathoadrenal responses. These mechanisms could contribute to arrhythmias during clinical hypoglycemic episodes.
© 2017 by the American Diabetes Association.
Figures
References
-
- Patel A, MacMahon S, Chalmers J, et al.; ADVANCE Collaborative Group . Intensive blood glucose control and vascular outcomes in patients with type 2 diabetes. N Engl J Med 2008;358:2560–2572 - PubMed
-
- Duckworth W, Abraira C, Moritz T, et al.; VADT Investigators . Glucose control and vascular complications in veterans with type 2 diabetes. N Engl J Med 2009;360:129–139 - PubMed
-
- Zoungas S, Patel A, Chalmers J, et al.; ADVANCE Collaborative Group . Severe hypoglycemia and risks of vascular events and death. N Engl J Med 2010;363:1410–1418 - PubMed
-
- Mellbin LG, Rydén L, Riddle MC, et al.; ORIGIN Trial Investigators . Does hypoglycaemia increase the risk of cardiovascular events? A report from the ORIGIN trial. Eur Heart J 2013;34:3137–3144 - PubMed
Publication types
MeSH terms
Substances
Grants and funding
LinkOut - more resources
Full Text Sources
Other Literature Sources
Medical
