. 2017 Mar 7;114(10):2735-2740.
doi: 10.1073/pnas.1621218114. Epub 2017 Jan 30.

Alterations of p11 in brain tissue and peripheral blood leukocytes in Parkinson's disease

Affiliations

Alterations of p11 in brain tissue and peripheral blood leukocytes in Parkinson's disease

Holly Green et al. Proc Natl Acad Sci U S A. .

Abstract

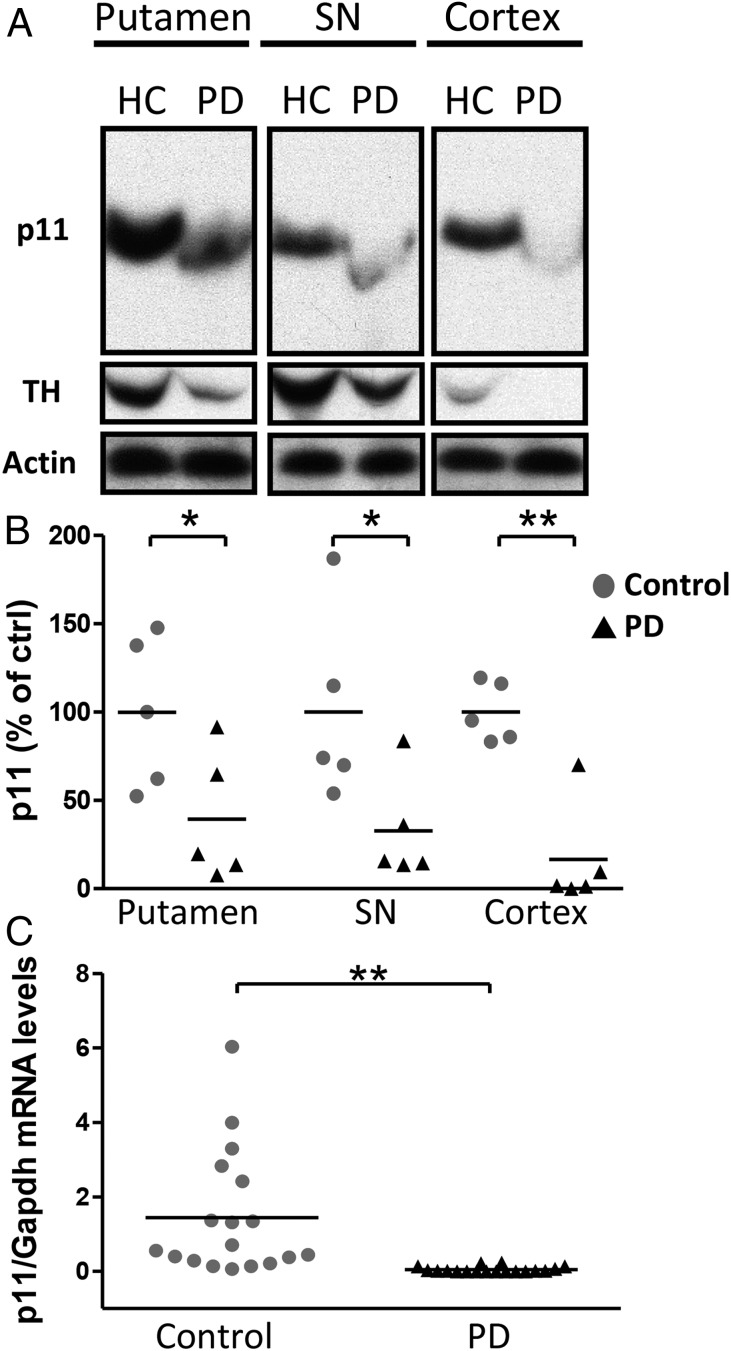
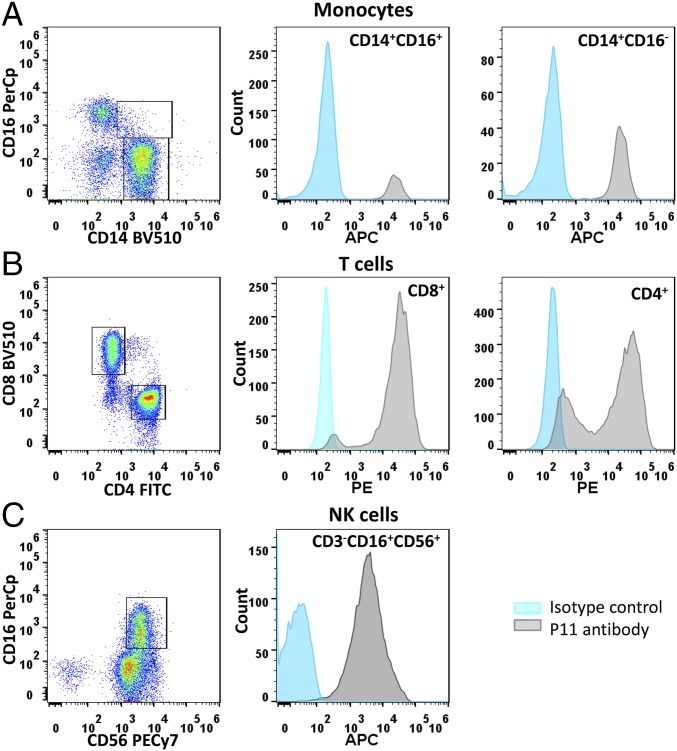
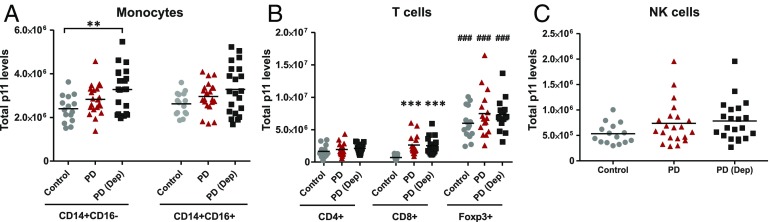
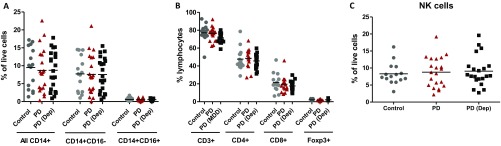
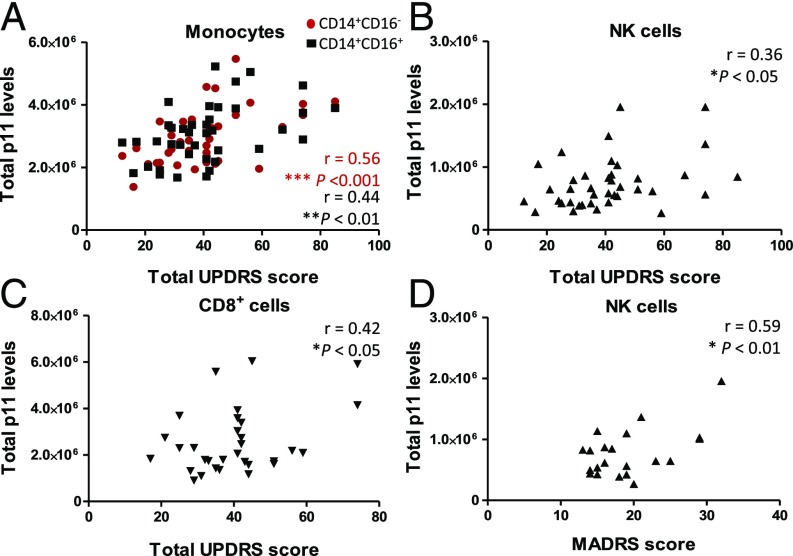
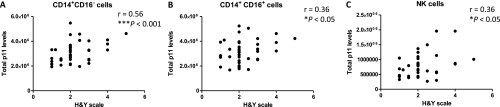
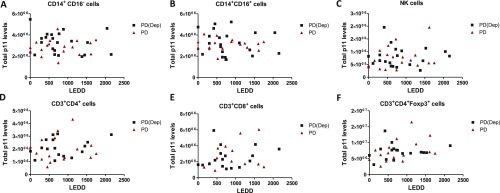
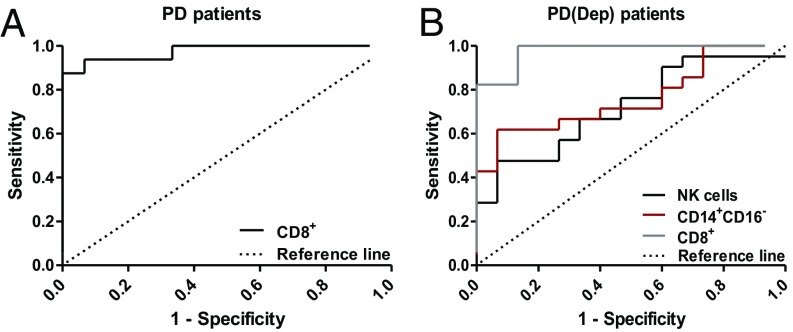
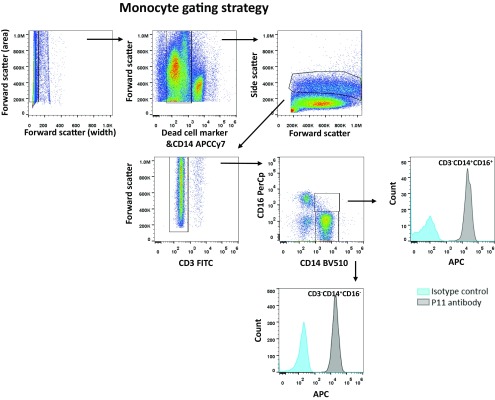
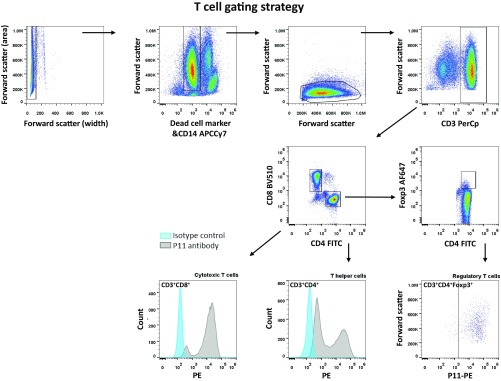
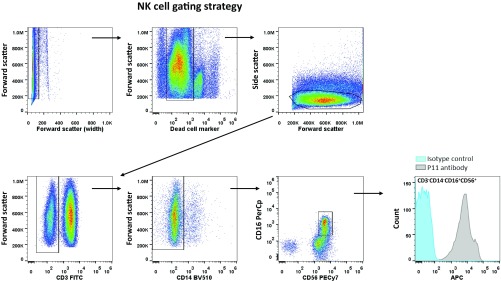
Individuals with Parkinson's disease (PD) often suffer from comorbid depression. P11 (S100A10), a member of the S100 family of proteins, is expressed widely throughout the body and is involved in major depressive disorder and antidepressant response. Central p11 levels are reduced in postmortem tissue from depressed individuals; however, p11 has not yet been investigated in PD patients with depression or those without depression. We investigated p11 levels in postmortem PD brains and assessed whether peripheral p11 levels correlate with disease severity. Substantia nigra, putamen, and cortical p11 protein levels were assessed in postmortem brain samples from PD patients and matched controls. In a different set of postmortem brains, p11 mRNA expression was measured in dopaminergic cells from the substantia nigra. Both p11 protein and mRNA levels were decreased in PD patients. Peripheral p11 protein levels were investigated in distinct leukocyte populations from PD patients with depression and those without depression. Monocyte, natural killer (NK) cell, and cytotoxic T-cell p11 levels were positively associated with the severity of PD, and NK cell p11 levels were positively associated with depression scores. Given that inflammation plays a role in both PD and depression, it is intriguing that peripheral p11 levels are altered in immune cells in both conditions. Our data provide insight into the pathological alterations occurring centrally and peripherally in PD. Moreover, if replicated in other cohorts, p11 could be an easily accessible biomarker for monitoring the severity of PD, especially in the context of comorbid depression.

Keywords: Parkinson's disease; S100A10; annexin II light chain; biomarker; depression.


Conflict of interest statement

The authors declare no conflict of interest.

Figures

Fig. 1.
Fig. 1.
P11 protein and mRNA levels in postmortem brain tissue from patients with PD and healthy controls. (A) Western blots of p11, TH, and actin from HC and PD human postmortem putamen, SN, and cortex. (B) Quantification of p11 protein levels from PD patients (n = 5) and HCs (n = 5). p11 levels were normalized to actin. Dots in scatterplots depict individual subjects. (C) qPCR analysis of p11 in LCM samples in three biological replicates from six HCs (n = 3 × 6 = 18) and six PD patients (n = 3 × 6 =18). Scatter diagram showing the mRNA levels of p11 normalized against Gapdh levels (n = 18). *P < 0.05; **P < 0.01 vs. HCs. Data were analyzed using two-way ANOVA and a subsequent pairwise comparison with Student’s t test (B) or using Student’s t test (C).
Fig. 2.
Fig. 2.
Specificity of p11 antibody in monocytes, T cells, and NK cells. Representative flow cytometry analysis of PBMCs with primary antibodies toward p11 (gray lines) or IgG1 isotype control (blue lines) in monocytes (CD14+CD16 and CD14+CD16+) (A), T cells (CD8+ and CD4+) (B), and NK cells (CD3CD16+CD56+) (C), demonstrating specific p11 expression.
Fig. 3.
Fig. 3.
Flow cytometry analysis of p11 levels in healthy controls and PD patients with and without depression. (A) p11 protein levels in classically activated (CD14+CD16) and non-classically activated (CD14+CD16+) monocytes from HCs, PD patients, and PD(Dep) patients (n = 15, 21, and 21, respectively). (B) p11 protein levels in T helper cells (CD4+), cytotoxic T cells (CD8+), and T regulatory cells (Foxp3+) from HCs and PD and PD(Dep) patients (n = 15, 16, and 17, respectively). (C) p11 protein levels in NK cells (CD3CD16+CD56+) from HCs and PD and PD(Dep) patients (n = 15, 21, and 21, respectively). Data are expressed as total p11 levels (MFI × % p11+ cells). In A–C, dots in the scatterplots depict individual subjects. **P < 0.01, ***P < 0.001 vs. the same cell type in HCs; ###P < 0.001 vs. CD4+ and CD8+ cells in the same participant group. Data were analyzed using one-way ANOVA and Tukey’s post hoc test.
Fig. S1.
Fig. S1.
PBMC composition in HCs, PD patients, and PD(Dep) patients. (A) Percentages of all monocytes (all CD14+), classically activated monocytes (CD14+CD16), and non-classically activated monocytes (CD14+CD16+) of live cells. (B) Percentages of all T cells (CD3+), T helper cells (CD4+), cytotoxic T cells (CD8+), and T regulatory cells (CD4+Foxp3+) of lymphocytes. (C) Percentages of NK cells (CD3CD16+CD56+) among live cells. Dots in scatterplots depict individual subjects. Data were analyzed using one way-ANOVA.
Fig. 4.
Fig. 4.
Association of peripheral p11 levels and clinical characteristics in distinct cell types. (A–C) Graphs showing positive correlations between total p11 levels in classically activated monocytes (CD14+CD16; n = 40) and non-classically activated monocytes (CD14+CD16+; n = 39) (A), NK cells (CD3CD16+CD56+; n = 40) (B), and cytotoxic T cells (CD8+; n = 32) (C) from all PD patients, with PD disease severity assessed by UPDRS score. (D) Graph showing a positive correlation between total p11 levels in NK cells from PD(Dep) patients and depressive symptoms, as measured by MADRS score (n = 21). Dots represent individual patients. Data were analyzed using Pearson’s correlation test. *P < 0.05; **P < 0.01; ***P < 0.001.
Fig. S2.
Fig. S2.
Association of peripheral p11 levels and H&Y scale scores in distinct cell types. Graphs showing positive correlations between total p11 levels in classically activated monocytes (CD14+CD16) (A), non-classically activated monocytes (CD14+CD16+) (B), and NK cells (CD3CD16+CD56+) (C) from PD patients, with H&Y score. Dots represent individual patients. Data were analyzed using Pearson’s correlation test, *P < 0.05; ***P < 0.001.
Fig. S3.
Fig. S3.
Patient LEDD scores correlated to PBMC total p11 levels in classically activated monocytes (CD14+CD16) (A), non-classically activated monocytes (CD14+CD16+) (B), NK cells (CD3CD16+CD56+) (C), T helper cells (CD4+) (D), cytotoxic T cells (CD8+) (E), and T regulatory cells (Foxp3+) (F). Dots represent individual patients. Data were analyzed using Pearson’s correlation test. No significant correlations were found when considering all PD patients, or the PD (red triangles) or PD(Dep) (black squares) group alone.
Fig. 5.
Fig. 5.
ROC curve of peripheral p11 levels as a discriminant function between PD patients and HCs. (A) CD8+ p11 levels as a discriminant function between PD patients without depression and HCs. ***P < 0.001. (B) NK cell, CD14+CD16 cell, and CD8+ cell p11 levels as a discriminant function between PD(Dep) patients and HCs. *P < 0.05; **P < 0.01; ***P < 0.001.
Fig. S4.
Fig. S4.
Representative flow cytometry analysis of PBMCs stained with a multicolor antibody panel to identify monocytes. Black arrows indicate the order of gating. Classically activated monocytes were identified as CD3CD14+CD16 leukocytes; non-classically activated monocytes, as CD3CD14+CD16+ leukocytes. Blue curves indicate isotype control antibody staining; gray curves, positive p11 antibody staining.
Fig. S5.
Fig. S5.
Representative flow cytometry analysis of PBMCs stained with a multicolor antibody panel to identify T cells. Black arrows indicate the order of gating. T helper cells were identified as CD3+CD4+ lymphocytes; cytotoxic T cells, as CD3+CD8+ lymphocytes; T regulatory cells, as CD3+CD4+Foxp3+ lymphocytes. Blue curves indicate isotype control antibody staining; gray curves, positive p11 antibody staining.
Fig. S6.
Fig. S6.
Representative flow cytometry analysis of PBMCs stained with a multicolor antibody panel to identify NK cells. Black arrows indicate the order of gating. NK cells were identified as CD3CD14CD16+CD56+ lymphocytes. Blue curves indicate isotype control antibody staining; gray curves, positive p11 antibody staining.

Comment in

References

    1. Kalia LV, Lang AE. Parkinson’s disease. Lancet. 2015;386(9996):896–912. - PubMed
    1. Chaudhuri KR, Schapira AH. Non-motor symptoms of Parkinson’s disease: Dopaminergic pathophysiology and treatment. Lancet Neurol. 2009;8(5):464–474. - PubMed
    1. Aarsland D, Påhlhagen S, Ballard CG, Ehrt U, Svenningsson P. Depression in Parkinson disease: Epidemiology, mechanisms and management. Nat Rev Neurol. 2011;8(1):35–47. - PubMed
    1. Frisina PG, Borod JC, Foldi NS, Tenenbaum HR. Depression in Parkinson’s disease: Health risks, etiology, and treatment options. Neuropsychiatr Dis Treat. 2008;4(1):81–91. - PMC - PubMed
    1. Brooks DJ, Pavese N. Imaging biomarkers in Parkinson’s disease. Prog Neurobiol. 2011;95(4):614–628. - PubMed

Publication types

MeSH terms