. 2017 Mar 1;37(9):2325-2335.
doi: 10.1523/JNEUROSCI.2266-16.2016. Epub 2017 Jan 30.

Transcranial Alternating Current Stimulation Attenuates Neuronal Adaptation

Affiliations

Transcranial Alternating Current Stimulation Attenuates Neuronal Adaptation

Kohitij Kar et al. J Neurosci. .

Abstract

We previously showed that brief application of 2 mA (peak-to-peak) transcranial currents alternating at 10 Hz significantly reduces motion adaptation in humans. This is but one of many behavioral studies showing that weak currents applied to the scalp modulate neural processing. Transcranial stimulation has been shown to improve perception, learning, and a range of clinical symptoms. Few studies, however, have measured the neural consequences of transcranial current stimulation. We capitalized on the strong link between motion perception and neural activity in the middle temporal (MT) area of the macaque monkey to study the neural mechanisms that underlie the behavioral consequences of transcranial alternating current stimulation. First, we observed that 2 mA currents generated substantial intracranial fields, which were much stronger in the stimulated hemisphere (0.12 V/m) than on the opposite side of the brain (0.03 V/m). Second, we found that brief application of transcranial alternating current stimulation at 10 Hz reduced spike-frequency adaptation of MT neurons and led to a broadband increase in the power spectrum of local field potentials. Together, these findings provide a direct demonstration that weak electric fields applied to the scalp significantly affect neural processing in the primate brain and that this includes a hitherto unknown mechanism that attenuates sensory adaptation.SIGNIFICANCE STATEMENT Transcranial stimulation has been claimed to improve perception, learning, and a range of clinical symptoms. Little is known, however, how transcranial current stimulation generates such effects, and the search for better stimulation protocols proceeds largely by trial and error. We investigated, for the first time, the neural consequences of stimulation in the monkey brain. We found that even brief application of alternating current stimulation reduced the effects of adaptation on single-neuron firing rates and local field potentials; this mechanistic insight explains previous behavioral findings and suggests a novel way to modulate neural information processing using transcranial currents. In addition, by developing an animal model to help understand transcranial stimulation, this study will aid the rational design of stimulation protocols for the treatment of mental illnesses, and the improvement of perception and learning.

Keywords: entrainment; local field potential; motion adaptation; motion after effect; neural mechanisms; transcranial alternating current stimulation.


Figures

Figure 1.
Figure 1.
Intracranial electric field measurements. Each panel represents the potential between two intracranial electrodes in area MT. a, Potentials during tACS stimulation using the local montage. b, Potentials during tACS using the remote montage. c, Potentials in the absence of tACS. This figure represents that local stimulation created a field of 0.12 V/m (the slope of the line in a), whereas remote stimulation resulted in only 0.03 V/m.
Figure 2.
Figure 2.
Experimental setup and procedure. a, Visual paradigm. On each trial, a dot pattern (random or coherent motion) was presented for 3 s followed by a blank period of 300 ms, and then a 300 ms coherent dot pattern (moving in 1 of 8 evenly spaced directions). Monkeys fixated a dot at the center of the monitor. Dot patterns were centered on the receptive field (RF) of the neuron being recorded. b, LFPs recorded during an example session without tACS. c, LFPs recorded during the same session as b with tACS. LFPs recorded during tACS were dominated by stimulation artifacts. Hence, we only analyzed data obtained at least 150 ms after tACS offset (green shading). d, Schematic of the local and remote tACS conditions. e, Tuning curve definition. Each tuning curve was described with four parameters: UR, TA, TW, and PD. ips, Impulses per second.
Figure 3.
Figure 3.
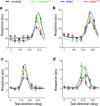
tACS effects in four example MT neurons. Each panel represents tuning curve estimates of an example neuron in the four experimental conditions: black represents unadapted; green represents unadapted with tACS; blue represents adapted; red represents adapted with tACS. Open circles represent the mean firing rate across trials. Error bars indicate SEM. The tuning curves were fitted to the mean firing rates (see Materials and Methods). a, tACS attenuated the adaptation-induced suppression in TA. b, tACS attenuated the adaptation-induced facilitation in TA. c, tACS reduced the adaptation-induced broadening of the tuning curve. d, tACS reduced the adaptation-induced sharpening of the tuning curve. No consistent tACS-induced changes were observed in the unadapted condition (green curves). Thus, tACS consistently attenuated adaptation-induced changes in neuronal tuning properties.
Figure 4.
Figure 4.
Population analysis of tACS-induced changes in tuning properties. a, Comparison of the change in TA induced by adaptation during tACS with the change in TA induced by adaptation alone. Each dot represents a single neuron. Lines indicate the result of an orthogonal linear regression fit (parameters written as text on panel). b, Same as a, but comparing changes in TW. c, Comparison of the tACS-induced change in TA in the unadapted conditions with tACS-induced change in TA in the adapted conditions. d, Same as c, but comparing changes in TW. This figure represents that the tuning curve changes induced by adaptation alone (and only those changes) are partially undone when adaptation is combined with tACS. In other words, tACS consistently attenuated adaptation.
Figure 5.
Figure 5.
Remote and local stimulation. a, Same as Figure 4a. Comparison of the change in TA induced by adaptation during tACS with the change in TA induced by adaptation alone. Each dot represents a single neuron. Lines indicate the result of an orthogonal linear regression fit (parameters written as text on panel). For the local montage (red dots/line), but not the remote montage (black dots/line), tACS attenuated adaptation, and the attenuation increased with the magnitude of the adaptation. b, The difference in TA after adaptation with local and remote tACS is shown as a function of the extent of adaptation per neuron. Consistent with our hypothesis, the differential effect of local compared with remote tACS was larger for those neurons that adapted more.
Figure 6.
Figure 6.
The influence of tACS on LFPs. a, The LFP response evoked by the adapter (dashed, unadaptPRE) and the test stimuli: solid, unadapt (black), adapt (blue), unadapttACS (green), and adapttACS (green). Data were averaged >76 sites. Adaptation reduced the N1 and N2 components (compare dashed black curve with solid black and blue curves). tACS attenuated the reduction of the N2 component and also increased the magnitude of the evoked LFP after 100 ms (compare red and green curves with the dashed black curve). b, Power spectrum of the LFP (see Materials and Methods). LFP power was significantly reduced in the test interval (compare dashed black curve with solid blue and black curves), but tACS attenuated this reduction (red and green curves). c, Normalized power spectrum of the LFP (see Materials and Methods). LFP power was significantly reduced in the test interval (compare dashed black curve with solid blue and black curves), but tACS attenuated this reduction (red and green curves). There was no evidence for a frequency-specific (i.e., 10 Hz) entrainment of the LFP during the test stimuli. Shaded areas and error bars represent SEM.
Figure 7.
Figure 7.
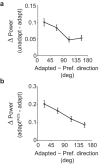
Changes in broadband LFP power after adaptation and tACS. a, Change in broadband LFP power after adaptation, as a function of the difference between the sites' PD (see Materials and Methods) and the adapters' direction of motion. Sites that were adapted near their PD of motion showed a greater decrease in broadband spectral power. b, Change in LFP power due to tACS applied during the adaptation phase. tACS increased power most in sites that adapted most. Error bars indicate SE.

References

    1. Ali MM, Sellers KK, Fröhlich F (2013) Transcranial alternating current stimulation modulates large-scale cortical network activity by network resonance. J Neurosci 33:11262–11275. 10.1523/JNEUROSCI.5867-12.2013 - DOI - PMC - PubMed
    1. Antal A, Varga ET, Nitsche MA, Chadaide Z, Paulus W, Kovács G, Vidnyánszky Z (2004) Direct current stimulation over MT+/V5 modulates motion aftereffect in humans. Neuroreport 15:2491–2494. 10.1097/00001756-200411150-00012 - DOI - PubMed
    1. Born RT, Bradley DC (2005) Structure and function of visual area MT. Annu Rev Neurosci 28:157–189. 10.1146/annurev.neuro.26.041002.131052 - DOI - PubMed
    1. Cronin B, Stevenson IH, Sur M, Körding KP (2010) Hierarchical Bayesian modeling and Markov chain Monte Carlo sampling for tuning-curve analysis. J Neurophysiol 103:591–602. 10.1152/jn.00379.2009 - DOI - PMC - PubMed
    1. Datta A, Bansal V, Diaz J, Patel J, Reato D, Bikson M (2009) Gyri-precise head model of transcranial direct current stimulation: improved spatial focality using a ring electrode versus conventional rectangular pad. Brain Stimul 2:201–207. 10.1016/j.brs.2009.03.005 - DOI - PMC - PubMed

Publication types

LinkOut - more resources