. 2017 Jan 16:7:670.
doi: 10.3389/fimmu.2016.00670. eCollection 2016.

Regulation of Marginal Zone B-Cell Differentiation by MicroRNA-146a

Affiliations

Regulation of Marginal Zone B-Cell Differentiation by MicroRNA-146a

Jennifer K King et al. Front Immunol. .

Abstract

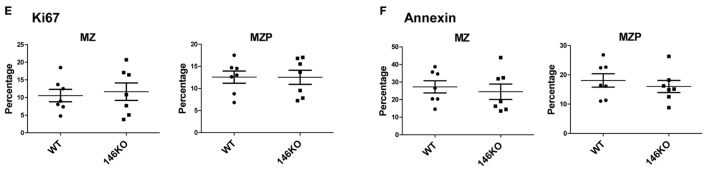
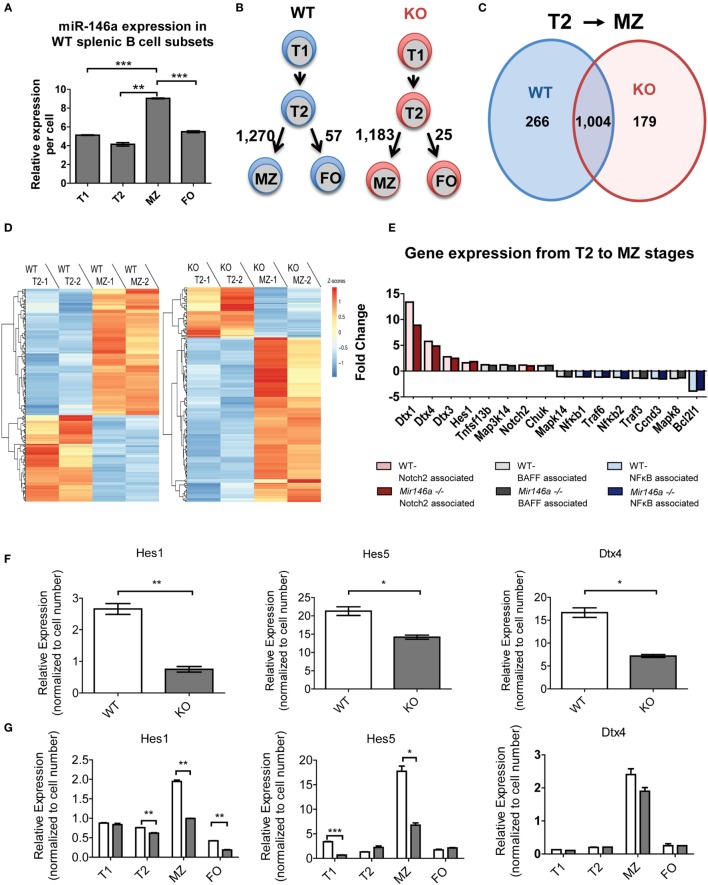
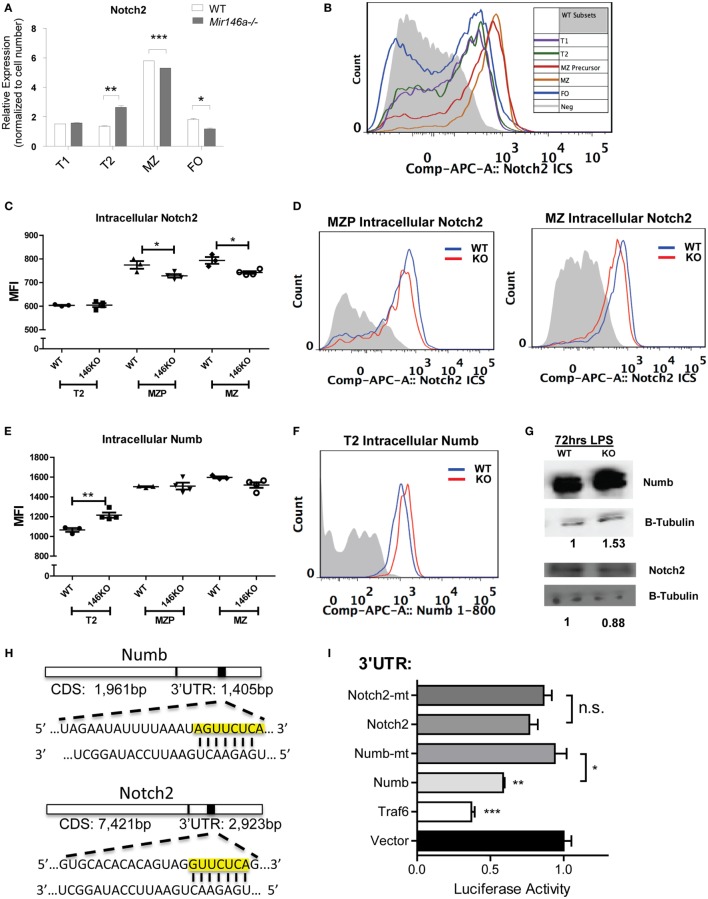
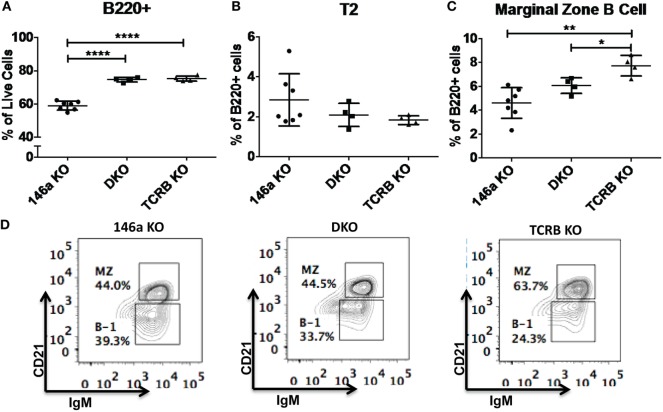
B-cell development in the bone marrow is followed by specification into functional subsets in the spleen, including marginal zone (MZ) B-cells. MZ B-cells are classically characterized by T-independent antigenic responses and require the elaboration of distinct gene expression programs for development. Given their role in gene regulation, it is not surprising that microRNAs are important factors in B-cell development. Recent work demonstrated that deficiency of the NFκB feedback regulator, miR-146a, led to a range of hematopoietic phenotypes, but B-cell phenotypes have not been extensively characterized. Here, we found that miR-146a-deficient mice demonstrate a reduction in MZ B-cells, likely from a developmental block. Utilizing high-throughput sequencing and comparative analysis of developmental stage-specific transcriptomes, we determined that MZ cell differentiation was impaired due to decreases in Notch2 signaling. Our studies reveal miR-146a-dependent B-cell phenotypes and highlight the complex role of miR-146a in the hematopoietic system.

Keywords: B-cell development; gene regulation; marginal zone B-cells; microRNA; notch signaling.


Figures

Figure 1
Figure 1
Mir146a−/− mice exhibit an increase in total splenic B-cells and immature splenic subsets, except exhibit a defect in marginal zone (MZ) B-cells. Cell numbers of (A) total live cells (*p = 0.015, ****p < 0.0001) and (B) B220+ B-cells (*p = 0.021, ****p < 0.0001) are shown in young mice, ages 8 weeks (n = 8–9 mice/group) and 12 weeks (n = 12–14 mice/group). Values are mean ± SD. (C) Representative FACS plots show maturing B-cell subsets in spleens of wild-type (WT) mice and Mir146a−/− knockout (KO) mice at 12 weeks. (D) Analysis of spleen subsets from WT mice and KO mice are shown at early ages (n = 12–14/group). Increases in the transitional T1 (***p = 0.0001) and T2 (*p = 0.043, ***p = 0.0003) B cells are shown. MZ B-cells are decreased in KO at ages 8 weeks (**p = 0.008), 12 weeks (****p < 0.0001). Values are mean ± SD.
Figure 2
Figure 2
Mir146a−/− mice show intact bone marrow B-cell development. Cell numbers of (A) total live cells (p = nss) and (B) B220+ B-cells (p = nss) are shown in young mice, ages 8 weeks (n = 8 mice/group) and 12 weeks (n = 12–14 mice/group), respectively. Values are mean ± SD. (C) Representative FACS plots show bone marrow B progenitors cells (Hardy Fractions) in bone marrow of WT (top panel) and KO mice (bottom panel) at 12 weeks. (D) Analysis of B progenitor cell subsets from WT and KO mice at early ages (8 and 12 weeks). Fraction A (*p = 0.006), fraction F at 8 weeks (*p = 0.025) and 12 weeks (*p = 0.001). Values are mean ± SD.
Figure 3
Figure 3
Lower Mir146a−/− marginal zone (MZ) B-cells are likely due to a spleen intrinsic developmental block. (A) Peripheral blood B220+ cells show no statistically significant difference in circulating MZ or follicular cells (n = 4 mice/group). (B) Mature B-cell subsets are shown in peripheral lymph nodes (B220+ **p = 0.002; FO **p = 0.001) (n = 7 mice/group). (C) Splenic macrophages, dendritic cells, and neutrophils show no differences in WT vs. KO (n = 7 mice/group). (D) CD138+ plasmablasts are shown in unstimulated spleens (0 h) and 96 h poststimulation with CD40 + IL4, with no significant differences (repeated in duplicate). (E) Intracellular Ki67 and (F) Annexin V staining are shown for MZ and MZ precursor (MZP) cells (n = 7 mice/group).
Figure 3
Figure 3
Lower Mir146a−/− marginal zone (MZ) B-cells are likely due to a spleen intrinsic developmental block. (A) Peripheral blood B220+ cells show no statistically significant difference in circulating MZ or follicular cells (n = 4 mice/group). (B) Mature B-cell subsets are shown in peripheral lymph nodes (B220+ **p = 0.002; FO **p = 0.001) (n = 7 mice/group). (C) Splenic macrophages, dendritic cells, and neutrophils show no differences in WT vs. KO (n = 7 mice/group). (D) CD138+ plasmablasts are shown in unstimulated spleens (0 h) and 96 h poststimulation with CD40 + IL4, with no significant differences (repeated in duplicate). (E) Intracellular Ki67 and (F) Annexin V staining are shown for MZ and MZ precursor (MZP) cells (n = 7 mice/group).
Figure 4
Figure 4
RNA sequencing (RNA-Seq) reveals differentially expressed miR-146a-dependent genes at the T2 to MZ transition. (A) Representative RT-qPCR showing relative expression levels of miR-146a in WT T1, T2, MZ, and FO splenic B-cell subsets per cell. (T1-MZ ***p = 0.0002; T2-MZ **p = 0.0015; MZ-FO ***p = 0.0009; repeated in duplicate). Values are mean ± SEM. (B) Schematic diagram depicting the number of differentially expressed genes between the T2 to MZ and T2 to FO transitions in both WT and KO mice. (C) Venn diagram comparing and contrasting the number of genes unique to and shared between the T2 to MZ transition in WT and KO mice. (D) Heat maps from the RNA-Seq data showing differentially expressed genes unique to the T2 to MZ transition in WT vs. genes unique to the T2 to MZ transition in KO (−1 and −2 denote replicates). (E) A waterfall plot of the RNA-Seq data displaying notable genes in three signaling pathways influencing MZ B-cell development. (F) Representative RT-qPCR analysis of Notch2-associated genes in bulk splenic B-cells 72 h after LPS stimulation repeated in duplicate (Hes1 **p = 0.0099; Hes5 *p = 0.032; Dtx4 *p = 0.013). (G) Quantified relative expression of Notch2-associated genes in splenic B-cell subsets using RT-qPCR (Hes1 T2 **p = 0.0082, MZ **p = 0.0014, FO **p = 0.0019; Hes5 T1 ***p = 0.001, MZ *p = 0.011; repeated in duplicate).
Figure 5
Figure 5
Mir146a−/− B-cells show decreased Notch2 and increased Numb, a direct target of miR-146a. (A) Representative RT-qPCR quantification of Notch2 expression in splenic B-cell subsets in wild-type (WT) vs. KO (T2 **p = 0.0057, marginal zone (MZ) ***p = 0.0002, FO *p = 0.016; repeated in duplicate). (B) Representative FACS overlay of intracellular Notch2 expression in WT B-cell subsets. (C) Quantitation of median fluorescence intensity (MFI) of intracellular staining of Notch2 in T2, MZ precursors (MZP), and MZ B-cells (MZP *p = 0.035; MZ *p = 0.014; n = 3–4 mice/group, repeated in duplicate). (D) Representative overlapping histograms of Notch2 MZ subsets in WT vs. KO mice. (E) Quantitation of MFI of intracellular staining of Numb in T2, MZP, and MZ B-cells (T2 **p = 0.0083; n = 4–5 mice/group). (F) Representative overlapping histogram of T2 Numb in WT vs. KO. (G) Western blot shows increased Numb protein and decreased Notch2 protein in LPS-stimulated splenic B-cells from WT and KO mice. β-Tubulin was used as a loading control and fold change was calculated using ImageJ (repeated in duplicate). (H) Numb 3′-untranslated region (UTR) and Notch2 3′-UTR containing the putative seed sequences of miR-146a (yellow box) are shown. (I) Luciferase assays quantitating repression with MGP/miR-146a relative to MGP alone for each of the UTRs depicted. Each measurement is representative of firefly luciferase normalized to renilla luciferase and was performed in triplicate, with the experiment repeated at least three times (Traf6 vs. Vector, ***p = 0.0004; Numb vs. Vector, **p = 0.0016; Numb vs. mutated Numb, *p = 0.012; Notch2 vs. mutated Notch2). All values are mean ± SEM.
Figure 6
Figure 6
Deficiency of marginal zone (MZ) B-cells in Mir146a−/− mice is not T cell dependent. Comparison of percentages of (A) total B220+ B-cells (****p < 0.0001), (B) T2 subset, and (C) MZ B-cells (**p = 0.002, *p = 0.022) in Mir146a−/− (146a KO), Mir146a−/− TCRβ−/− (DKO), and TCRβ−/− (TCRβ KO) mice. All non-annotated comparisons are not statistically significant (n = 4–7 mice/group, repeated in duplicate). (D) Representative FACS plots showing the MZ fraction in spleen in three mice groups.

References

    1. Allman D, Pillai S. Peripheral B cell subsets. Curr Opin Immunol (2008) 20(2):149–57.10.1016/j.coi.2008.03.014 - DOI - PMC - PubMed
    1. Pillai S, Cariappa A. The follicular versus marginal zone B lymphocyte cell fate decision. Nat Rev Immunol (2009) 9(11):767–77.10.1038/nri2656 - DOI - PubMed
    1. Stadanlick JE, Kaileh M, Karnell FG, Scholz JL, Miller JP, Quinn WJ, III, et al. Tonic B cell antigen receptor signals supply an NF-kappaB substrate for prosurvival BLyS signaling. Nat Immunol (2008) 9(12):1379–87.10.1038/ni.1666 - DOI - PMC - PubMed
    1. Tan JB, Xu K, Cretegny K, Visan I, Yuan JS, Egan SE, et al. Lunatic and manic fringe cooperatively enhance marginal zone B cell precursor competition for delta-like 1 in splenic endothelial niches. Immunity (2009) 30(2):254–63.10.1016/j.immuni.2008.12.016 - DOI - PubMed
    1. O’Connell RM, Rao DS, Chaudhuri AA, Baltimore D. Physiological and pathological roles for microRNAs in the immune system. Nat Rev Immunol (2010) 10(2):111–22.10.1038/nri2708 - DOI - PubMed