. 2016 Nov 18;2(11):e1600874.
doi: 10.1126/sciadv.1600874. eCollection 2016 Nov.

Single-cell analysis reveals a nestin+ tendon stem/progenitor cell population with strong tenogenic potentiality

Affiliations

Single-cell analysis reveals a nestin+ tendon stem/progenitor cell population with strong tenogenic potentiality

Zi Yin et al. Sci Adv. .

Abstract

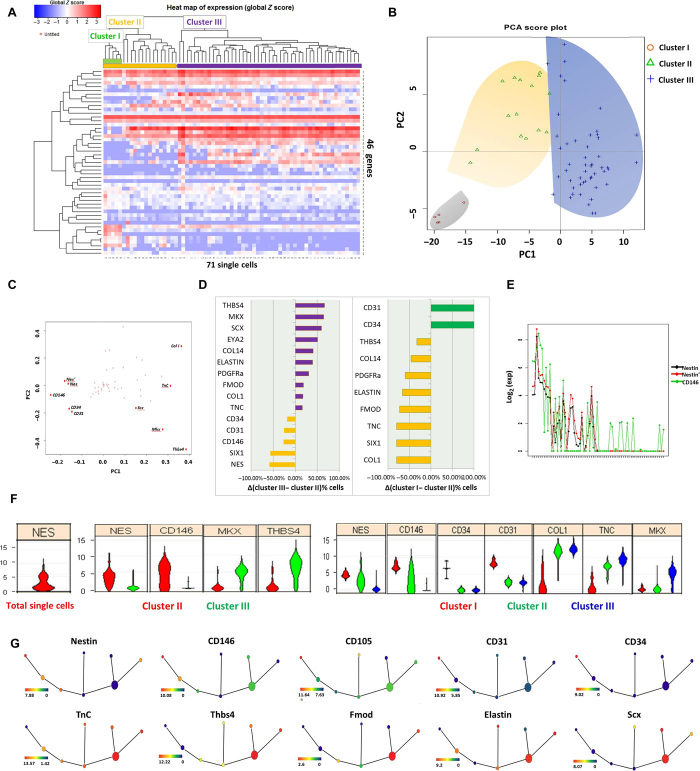
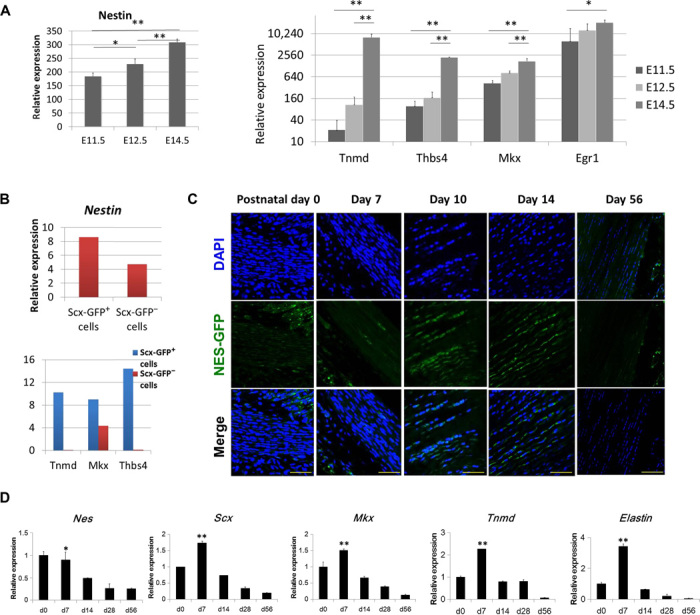
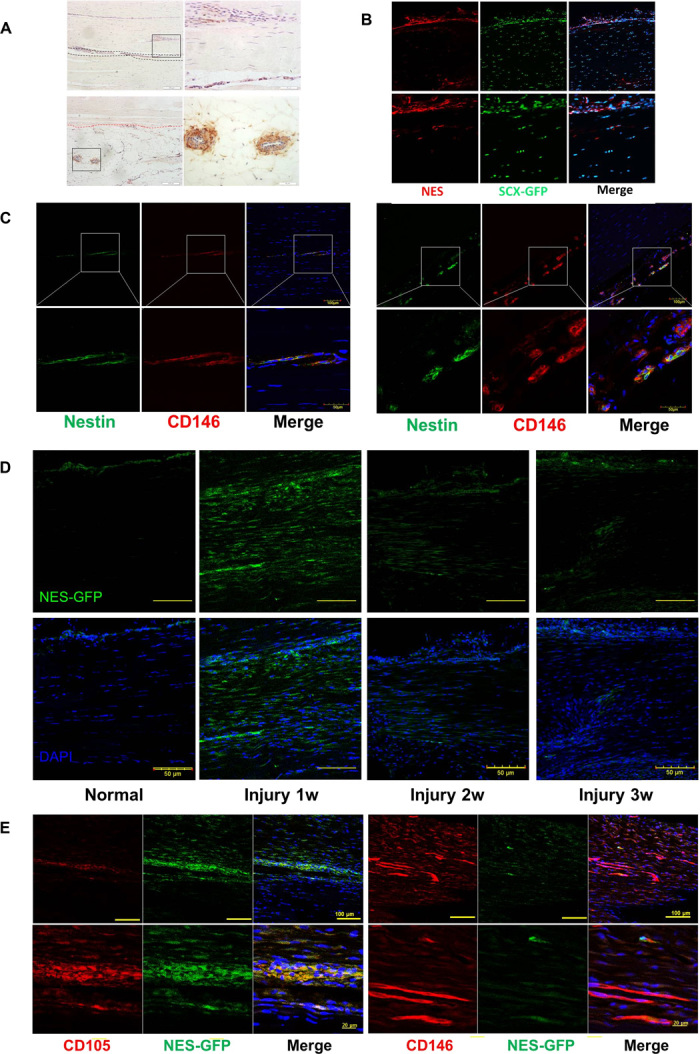
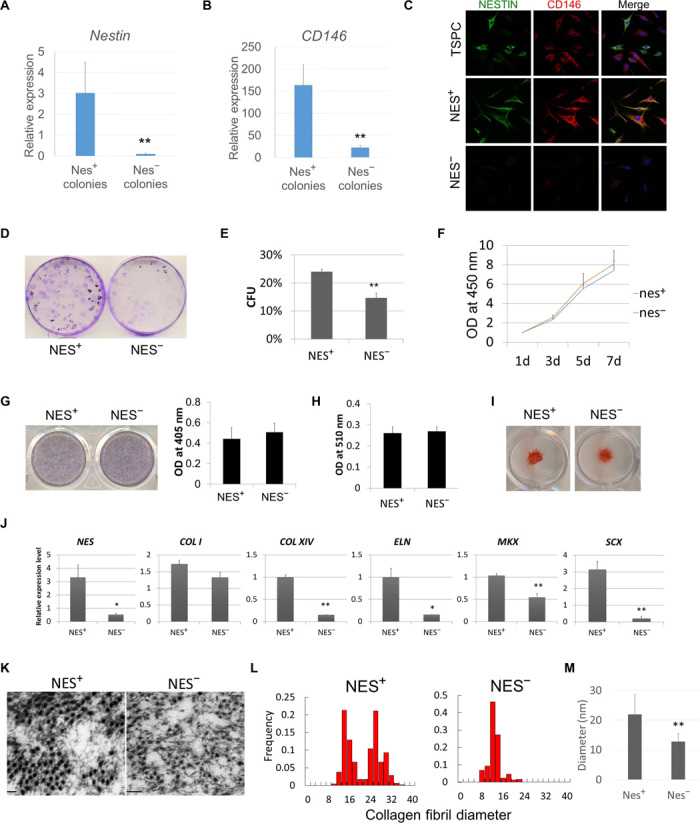
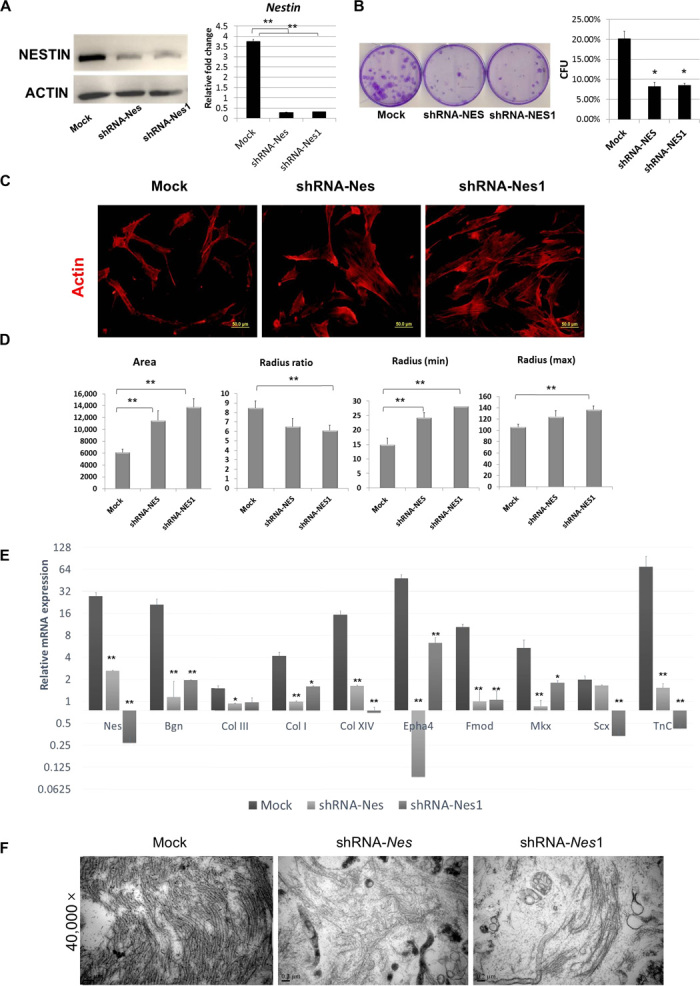
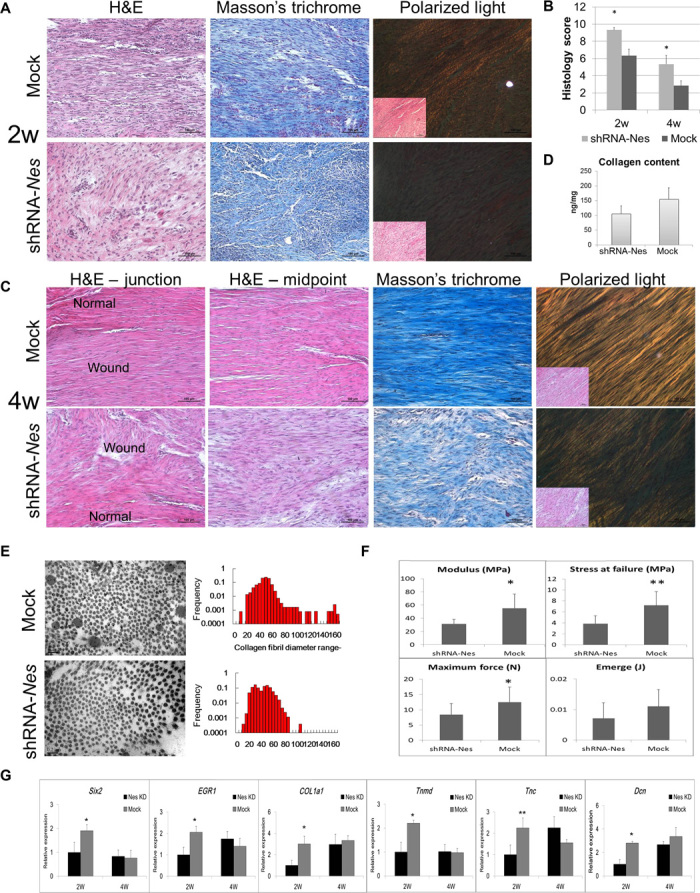
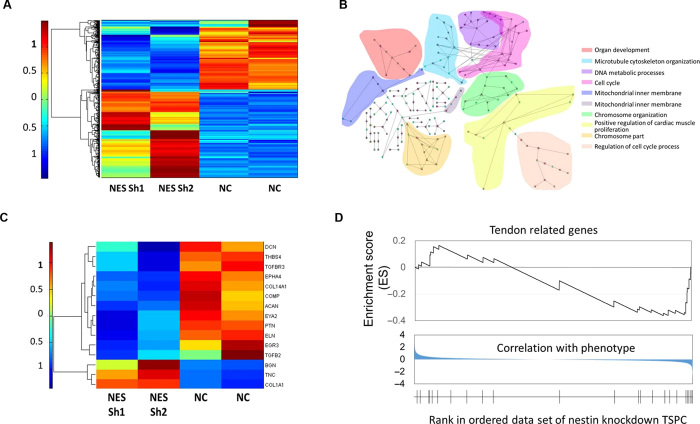
The repair of injured tendons remains a formidable clinical challenge because of our limited understanding of tendon stem cells and the regulation of tenogenesis. With single-cell analysis to characterize the gene expression profiles of individual cells isolated from tendon tissue, a subpopulation of nestin+ tendon stem/progenitor cells (TSPCs) was identified within the tendon cell population. Using Gene Expression Omnibus datasets and immunofluorescence assays, we found that nestin expression was activated at specific stages of tendon development. Moreover, isolated nestin+ TSPCs exhibited superior tenogenic capacity compared to nestin- TSPCs. Knockdown of nestin expression in TSPCs suppressed their clonogenic capacity and reduced their tenogenic potential significantly both in vitro and in vivo. Hence, these findings provide new insights into the identification of subpopulations of TSPCs and illustrate the crucial roles of nestin in TSPC fate decisions and phenotype maintenance, which may assist in future therapeutic strategies to treat tendon disease.

Keywords: Tendons stem/progenitor cells; nestin; single-cell gene analysis; tenogenesis.


Figures

Fig. 1
Fig. 1. Single-cell transcriptional profiling reveals distinct subpopulations of tendon cells and their corresponding markers.
(A) Heat map showing that the unbiased HC well separates the single-cell gene expression profiles of 71 individual cells isolated by the C1 system and analyzed for expression of 46 gene transcripts by qRT-PCR. Top colored bars indicate clusters identified as clusters I (green), II (orange), and III (purple). (B) PCA of the full qRT-PCR results of 71 tendon-derived cells. Each dot represents a cell, colored according to its subpopulation as determined by HC. Cells are plotted against the first two PCs. (C) Genes projected onto the first two PC loadings. (D) Different genes with expression that was on or off in each group (cluster II/cluster III and cluster I/remainder of cluster II). The proportion differences of cells between clusters II and III, in descending order from top to bottom, are shown. Purple indicates genes that are overrepresented in cells of cluster III. Orange indicates genes that are overrepresented in cells of cluster II. Green represents genes that are overrepresented in cells of cluster I. (E) Correlation analysis of nestin (NES). (F) Violin plots represent expression of a number of genes (fold change above background) in individual cells. (G) SPADE from single-cell expression pattern of 46 genes. Overlaid expression patterns of different genes contribute in defining distinct cell populations.
Fig. 2
Fig. 2. Nestin is implicated in tendon development.
(A) Expression of nestin and teno-lineage marker genes obtained from Scx-GFP forelimb tendon during mouse embryogenesis. (B) Expression of nestin and teno-lineage marker genes in Scx-GFP+ cells and Scx-GFP cells obtained from E13.5 forelimb samples. Data are presented as means ± SD. (C) Nes-GFP expression in the developing mouse Achilles tendon between postnatal days 0 and 56 (n = 5). DAPI, 4′,6-diamidino-2-phenylindole. (D) Nestin and teno-lineage marker gene expression in the developing mouse Achilles tendon between postnatal days 0 and 56. Data are presented as means ± SD. Scale bars, 50 μm.
Fig. 3
Fig. 3. Localization of nestin+ cells in tendon tissue and endogenous tendon injury repair.
(A) Immunofluorescence staining of nestin expression in the human Achilles tendon endotenon (region between the black dashed lines) and surrounding blood vessels in the peritenon (area below the red dashed line). Scale bars, 200 μm (right); 50 μm (left). (B) nestin expression in Scx-GFP mouse Achilles tendon. (C) Nestin and CD146 expression in human Achilles tendon. Scale bars, 100 μm (top); 50 μm (bottom). (D) Nes-GFP expression in normal and injured Achilles tendon 1, 2, and 3 weeks after surgery (n = 5). Scale bars, 50 μm. (E) Immunofluorescence staining of CD105 and CD146 expression at the injured tendon of Nes-GFP mice 1 week after injury (n = 5). Scale bars, 100 μm (top); 20 μm (bottom).
Fig. 4
Fig. 4. Nestin+ TSPCs displayed stronger capacity for tenogenesis than did nestin TSPCs.
qPCR analyses of nestin (A) and CD146 (B) expression in selected nestin+ and nestin colony-forming TSPCs (n = 6, representative data from three independent experiments). (C) Immunofluorescence staining of nestin and CD146 expression in TSPCs, selected nestin+ TSPCs, and nestin TSPCs. (D) CFU assay for assessing the self-renewal of nestin+ and nestin TSPCs. (E) Quantification data of the CFU assay (n = 6). (F) Proliferation rate of nestin+ and nestin TSPCs (n = 6). OD, optical density. (G) ALP staining and quantification of Alizarin Red S staining of nestin+ and nestin TSPCs after osteogenic induction (n = 6). (H) The quantification of accumulated lipid vacuoles by Oil Red O staining showed no difference in adipogenic potential between nestin+ and nestin TSPCs (n = 6). (I) Safranin O staining of nestin+ and nestin TSPCs after chondrogenic induction. (J) Tendon-associated gene expression in cell sheet formed by nestin+ and nestin TSPCs (n = 6). (K) Transmission electron micrographs of cross sections of collagen fibrils within cell sheets formed by nestin+ and nestin TSPCs. (L) Histogram showing the distribution range of collagen fibril diameters in nestin+ and nestin TSPCs. (M) Average diameter of collagen fibrils in nestin+ and nestin TSPCs (n = 6). Results are presented as means ± SD.
Fig. 5
Fig. 5. Nestin is important for self-renewal and phenotypic maintenance of TSPCs.
(A) Western blot and qPCR demonstrated successful knockdown of nestin expression in TSPCs. (B) CFU assay showed that self-renewal of TSPCs was decreased by the knockdown of nestin (n = 3). (C) Immunofluorescence staining of F-actin, expression in TSPCs infected with RNA interference (RNAi) against nestin (shRNA-Nes/shRNA-Nes1), or a control scrambled sequence (mock). (D) Quantitative data on cell morphology change of TSPCs under nestin knockdown. Results are presented as means ± SD (n = 40 to 60). Scale bars, 50 μm. (E) qPCR analyses showing that the expression of tendon-associated genes in TSPC cell sheets from the control group was significantly higher than that from the nestin knockdown group (n = 5). (F) Transmission electron micrographs of collagen fibrils in cell sheets from the control and nestin knockdown groups. *P < 0.05, **P < 0.01 (one-way ANOVA). Results are presented as means ± SD (n = 5). Scale bars, 50 μm (B); 200 nm (D).
Fig. 6
Fig. 6. Knockdown of nestin impaired tendon repair and regeneration in a rat model of patellar tendon defect.
(A) Morphology of the repaired tissue site along the axis of the tendon in the control and nestin knockdown groups. H&E staining and polarized light microscopy images showing the collagen fibrils 2 weeks after implantation (n = 6). (B) Maturation of repaired tendon was assessed by histology scoring (n = 6). (C) H&E staining showing the histology of the junction between normal tendon and neo-tendon, as well as the midpoint of neo-tendon formation 4 weeks after implantation. Masson’s trichrome staining showing the deposited collagen at the repaired tissue site 4 weeks after implantation. Polarized light microscopy image showing the maturation of the newly formed collagen fibrils (n = 6). (D) Quantitative analyses of the collagen content. (E) Transmission electron micrographs of cross sections of collagen fibrils in the control and nestin knockdown groups from repaired tendons 4 weeks after implantation. Distribution of collagen fibril diameters of repaired tendons in the control and nestin knockdown groups 4 weeks after implantation (n = 6). (F) Biomechanical properties of the repaired tendon (failure force, energy absorbed at failure, stress at failure, and modulus) in the control and nestin knockdown groups 4 weeks after implantation (n = 6). Results are presented as means ± SD. (G) qPCR analyses showing the expression of tendon-associated genes in the repaired tendon (n = 3). Results are presented as means ± SEM. *P < 0.05, **P < 0.01 (Student’s t test). Scale bars, 100 μm (A and D); 200 nm (E).
Fig. 7
Fig. 7. Transcriptional analysis of nestin knockdown in TSPC.
(A) Heat map of the differentially expressed gene profiles of nestin knockdown in TSPCs. Two samples were used for each. (B) Top 80 GO network analysis according to the ES of the GSEA of the whole genome, which shows the relationship of down-regulated ontology. The GO was enriched in the parental GO involved in the organ development, DNA metabolism, and cell cycle, presented in different colors. (C) Heat map of tendon-related gene expression values showing that most of the tendon-related genes were down-regulated after nestin knockdown. (D) GSEA results of tendon-related genes, showing a depression.

Similar articles

Cited by

References

    1. Docheva D., Müller S. A., Majewski M., Evans C. H., Biologics for tendon repair. Adv. Drug Deliv. Rev. 84, 222–239 (2015). - PMC - PubMed
    1. Gaspar D., Spanoudes K., Holladay C., Pandit A., Zeugolis D., Progress in cell-based therapies for tendon repair. Adv. Drug Deliv. Rev. 84, 240–256 (2015). - PubMed
    1. Bi Y., Ehirchiou D., Kilts T. M., Inkson C. A., Embree M. C., Sonoyama W., Li L., Leet A. I., Seo B.-M., Zhang L., Shi S., Young M. F., Identification of tendon stem/progenitor cells and the role of the extracellular matrix in their niche. Nat. Med. 13, 1219–1227 (2007). - PubMed
    1. Lovati A. B., Corradetti B., Lange C. A., Recordati C., Bonacina E., Bizzaro D., Cremonesi F., Characterization and differentiation of equine tendon-derived progenitor cells. J. Biol. Regul. Homeost. Agents 25, S75–S84 (2011). - PubMed
    1. Rui Y.-F., Lui P. P. Y., Li G., Fu S. C., Lee Y. W., Chan K. M., Isolation and characterization of multipotent rat tendon-derived stem cells. Tissue Eng. Part A 16, 1549–1558 (2010). - PubMed