. 2017 Jan 25;3(1):e1601426.
doi: 10.1126/sciadv.1601426. eCollection 2017 Jan.

Accelerated freshening of Antarctic Bottom Water over the last decade in the Southern Indian Ocean

Affiliations

Accelerated freshening of Antarctic Bottom Water over the last decade in the Southern Indian Ocean

Viviane V Menezes et al. Sci Adv. .

Abstract

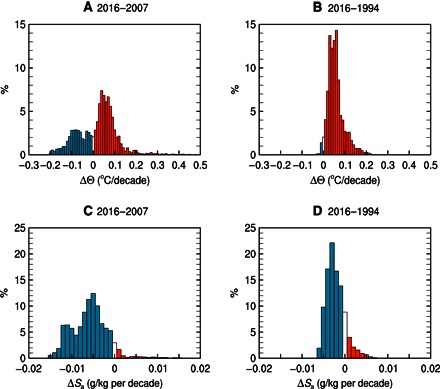
Southern Ocean abyssal waters, in contact with the atmosphere at their formation sites around Antarctica, not only bring signals of a changing climate with them as they move around the globe but also contribute to that change through heat uptake and sea level rise. A repeat hydrographic line in the Indian sector of the Southern Ocean, occupied three times in the last two decades (1994, 2007, and, most recently, 2016), reveals that Antarctic Bottom Water (AABW) continues to become fresher (0.004 ± 0.001 kg/g decade-1), warmer (0.06° ± 0.01°C decade-1), and less dense (0.011 ± 0.002 kg/m3 decade-1). The most recent observations in the Australian-Antarctic Basin show a particularly striking acceleration in AABW freshening between 2007 and 2016 (0.008 ± 0.001 kg/g decade-1) compared to the 0.002 ± 0.001 kg/g decade-1 seen between 1994 and 2007. Freshening is, in part, responsible for an overall shift of the mean temperature-salinity curve toward lower densities. The marked freshening may be linked to an abrupt iceberg-glacier collision and calving event that occurred in 2010 on the George V/Adélie Land Coast, the main source region of bottom waters for the Australian-Antarctic Basin. Because AABW is a key component of the global overturning circulation, the persistent decrease in bottom water density and the associated increase in steric height that result from continued warming and freshening have important consequences beyond the Southern Indian Ocean.

Keywords: AABW; Antartica; Calving; Changes; Iceberg; Salinity; T-S Properties; Water Masses; abyss; climate change.


Figures

Fig. 1
Fig. 1. Location of stations from the three I08S occupations in the southeastern Indian Ocean (filled squares), local bottom depths (blue to brown shading), and mean eddy kinetic energy field (rainbow map).
The dashed line is a schematic view of AABW circulation based on the studies by Rintoul (5) and Orsi et al. (16). Bottom depths are 2-min bathymetry (40). Eddy kinetic energy (EKE) field is from 20 years of multisatellite altimetry data. Only EKE values larger than 250 cm2/s2 are plotted. South of 63°S, the 1994 I08S occupation is augmented by data from the Australian SR03C line. AAB, Australian-Antarctic Basin.
Fig. 2
Fig. 2. Regional long-term changes in temperature and salinity.
Mean differences in conservative temperature (ΔΘ) (A) and Absolute Salinity (ΔSa) (B) between 1994 and 2016. Red curves represent the PET region (64°S to 60°S), green curves represent the Australian-Antarctic Basin (60°S to 45°S), and blue curves represent the SAB (45°S to 30°S). Shading indicates 95% confidence intervals (CIs) on the means.
Fig. 3
Fig. 3. Spatiotemporal patterns of the AABW rates of changes.
Rates of change in conservative temperature (ΔΘ) (A and B), Absolute Salinity (ΔSa) (C and D), and potential density referenced to 4000 dbar (Δσ4) (E and F) in the AABW domain. Left and right columns show differences between 2007 to 2016 and 1994 to 2016, respectively. AABW domain is defined as the region where θ < 0°C in any I08S occupation. (A and B) Black curves are σ4 = 45.9 and 46.1 kg/m3 for 2016. Blue curves are the same isopycnals for 2007 in (A) and 1994 in (B). Thick green curves indicate γn = 28.27 kg/m3 in 2016 (left plots) and 1994 (right plots). Gray shading indicates bottom topography.
Fig. 4
Fig. 4. AABW changes north of 64°S.
Histograms of AABW changes north of 64°S (includes both the PET and the Australian-Antarctic Basin) for conservative temperature (ΔΘ) and Absolute Salinity (ΔSa) between 2007 and 2016 (A and C) and 1994 and 2016 (B and D). Blue indicates negative changes (cooling/freshening), red indicates positive changes (warming/salinification), and white indicates small/zero change. The y axis shows the percentage of grid cells that fall into each interval (bin) (x axis) normalized by the total number classified as AABW (θ < 0°C).
Fig. 5
Fig. 5. Conservative temperature–Absolute Salinity (Θ − Sa) relationships in 1994 (green), 2007 (orange), and 2016 (pink) in the Australian-Antarctic Basin (60°S to 45°S).
Colored solid curves indicate means computed on isopycnals, and dashes are the respective minima and maxima. Black curves are σ4 densities. Gray shading indicates Θ < 0°C (AABW region).
Fig. 6
Fig. 6. AABW changes in the Australian-Antarctic Basin by decades.
Changes in conservative temperature (ΔΘ) (A) and Absolute Salinity (ΔSa) (B) for the AABW in the Australian-Antarctic Basin (60°S to 45°S). Reddish shadings are used for the differences between 2007 and 2016, and blue curves are used for differences between 1994 and 2007. Vertical black lines mark zero change. (C) Changes in Absolute Salinity between 2007 and 2016 and between 1994 and 2007 averaged (density space) over the Australian-Antarctic Basin. Dashed curves are 95% CIs on the means.

References

    1. Bindoff N. L., Hobbs W. R., Deep ocean freshening. Nat. Clim. Chang. 3, 864–865 (2013).
    1. Whitworth T., III, Two modes of bottom water in the Australian-Antartic basin. Geophys. Res. Lett. 29, 17-1–17-3 (2002).
    1. Jacobs S. S., Bottom water production and its links with the thermohaline circulation. Antarct. Sci. 16, 427–437 (2004).
    1. Aoki S., Rintoul S. R., Ushio S., Watanabe S., Bindoff N. L., Freshening of the Adélie Land Bottom Water near 140°E. Geophys. Res. Lett. 32, L23601 (2005).
    1. Rintoul S. R., Rapid freshening of Antarctic Bottom Water formed in the Indian and Pacific oceans. Geophys. Res. Lett. 34, L06606 (2007).

LinkOut - more resources