

Generation of anatomically realistic numerical phantoms for photoacoustic and ultrasonic breast imaging
- PMID: 28138689
- PMCID: PMC5282404
- DOI: 10.1117/1.JBO.22.4.041015
Generation of anatomically realistic numerical phantoms for photoacoustic and ultrasonic breast imaging
Abstract
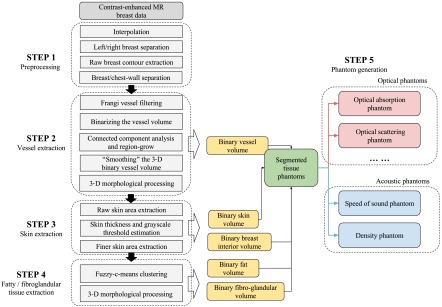
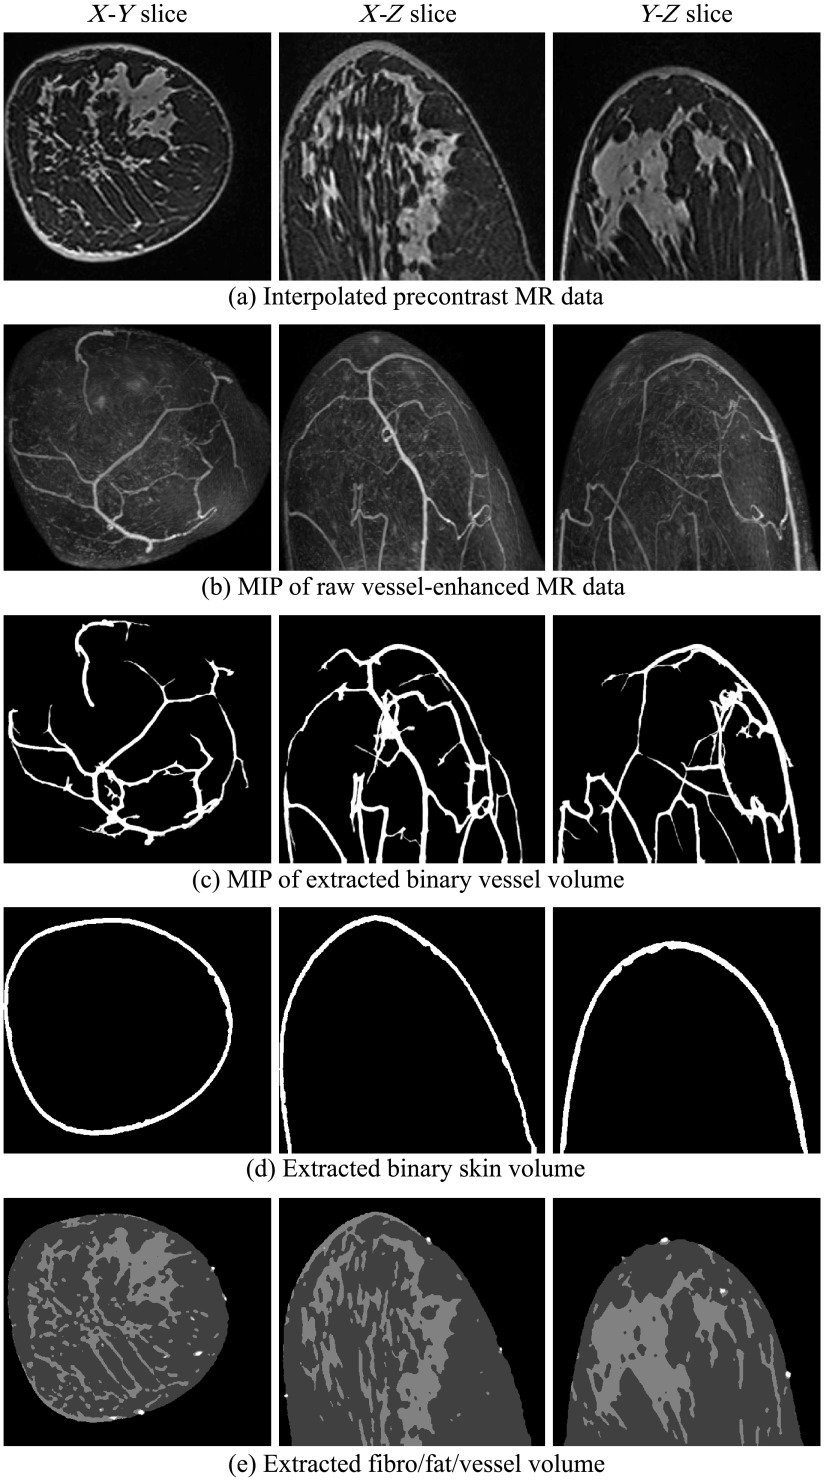
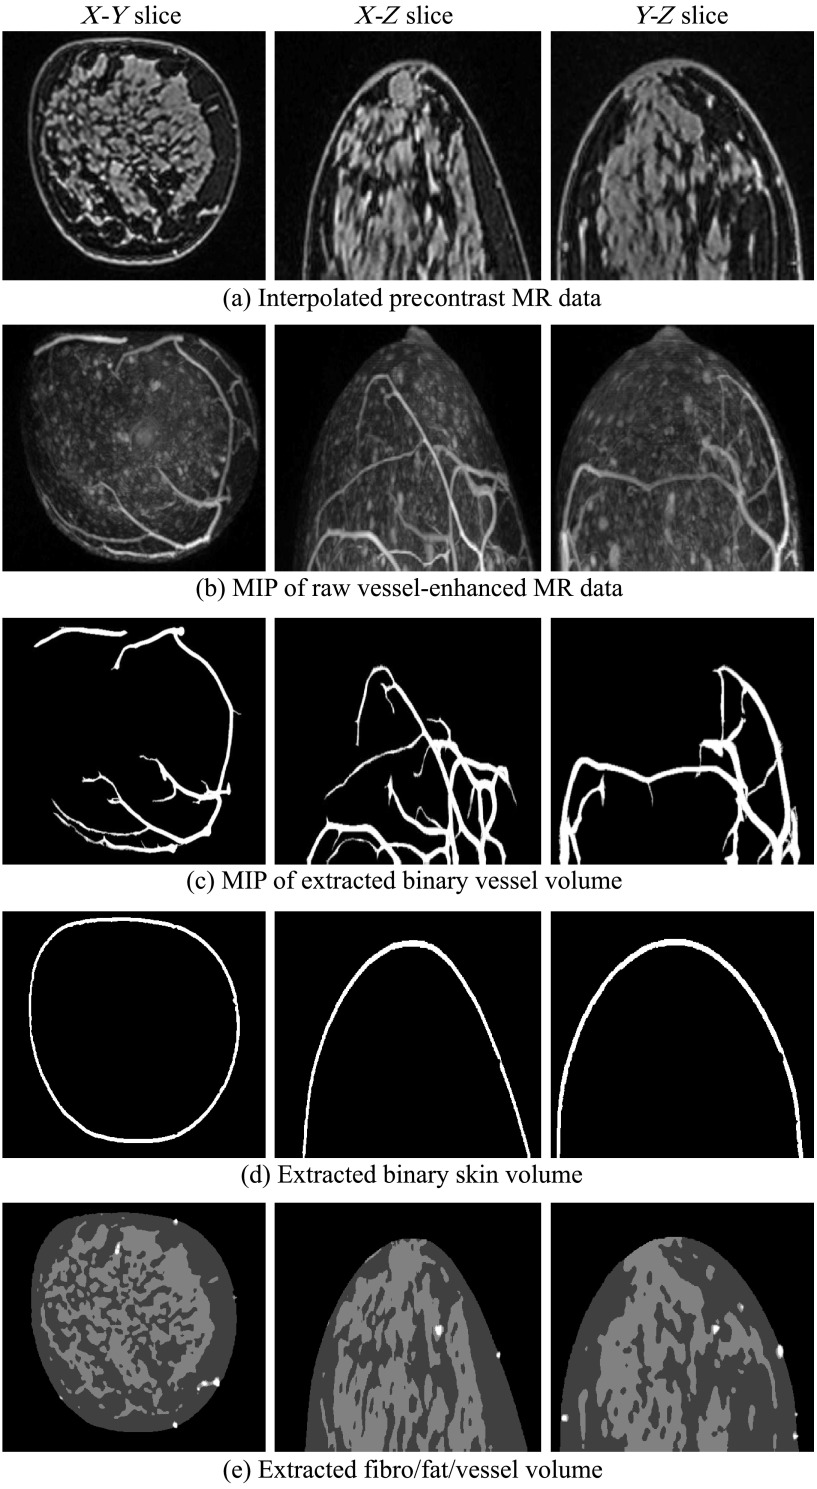
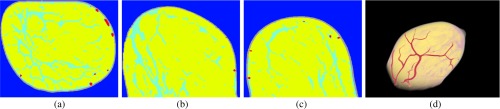
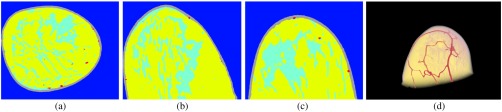
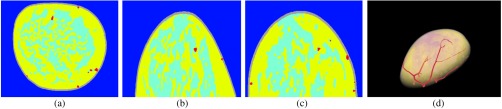
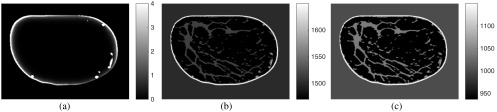
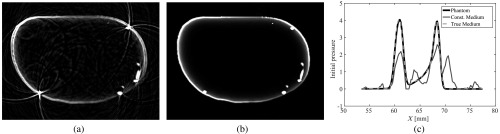
Photoacoustic computed tomography (PACT) and ultrasound computed tomography (USCT) are emerging modalities for breast imaging. As in all emerging imaging technologies, computer-simulation studies play a critically important role in developing and optimizing the designs of hardware and image reconstruction methods for PACT and USCT. Using computer-simulations, the parameters of an imaging system can be systematically and comprehensively explored in a way that is generally not possible through experimentation. When conducting such studies, numerical phantoms are employed to represent the physical properties of the patient or object to-be-imaged that influence the measured image data. It is highly desirable to utilize numerical phantoms that are realistic, especially when task-based measures of image quality are to be utilized to guide system design. However, most reported computer-simulation studies of PACT and USCT breast imaging employ simple numerical phantoms that oversimplify the complex anatomical structures in the human female breast. We develop and implement a methodology for generating anatomically realistic numerical breast phantoms from clinical contrast-enhanced magnetic resonance imaging data. The phantoms will depict vascular structures and the volumetric distribution of different tissue types in the breast. By assigning optical and acoustic parameters to different tissue structures, both optical and acoustic breast phantoms will be established for use in PACT and USCT studies.
Figures
References
-
- Oraevsky A., Karabutov A., “Optoacoustic tomography,” Biomed. Photonics Handb. 34, 1–34 (2003).http://www.crcnetbase.com/doi/book/10.1201/9780203008997 - DOI
-
- Wang L. V., Hu S., “Photoacoustic tomography: in vivo imaging from organelles to organs,” Science 335(6075), 1458–1462 (2012).http://dx.doi.org/10.1126/science.1216210 - DOI - PMC - PubMed
-
- Anastasio M. A., et al. , “Improving limited-view reconstruction in photoacoustic tomography by incorporating a priori boundary information,” Proc. SPIE 6856, 68561B (2008).http://dx.doi.org/10.1117/12.764178 - DOI
-
- Duric N., et al. , “Detection of breast cancer with ultrasound tomography: first results with the computed ultrasound risk evaluation (CURE) prototype,” Med. Phys. 34(2), 773 (2007).http://dx.doi.org/10.1118/1.2432161 - DOI - PubMed
-
- Schreiman J. S., et al. , “Ultrasound transmission computed tomography of the breast,” Radiology 150, 523–530 (1984).http://dx.doi.org/10.1148/radiology.150.2.6691113 - DOI - PubMed
MeSH terms
Grants and funding
LinkOut - more resources
Full Text Sources
Other Literature Sources
Medical
Miscellaneous
