. 2017 Jan 31:8:14143.
doi: 10.1038/ncomms14143.

Evidence for ACTN3 as a genetic modifier of Duchenne muscular dystrophy

Collaborators, Affiliations

Evidence for ACTN3 as a genetic modifier of Duchenne muscular dystrophy

Marshall W Hogarth et al. Nat Commun. .

Abstract

Duchenne muscular dystrophy (DMD) is characterized by muscle degeneration and progressive weakness. There is considerable inter-patient variability in disease onset and progression, which can confound the results of clinical trials. Here we show that a common null polymorphism (R577X) in ACTN3 results in significantly reduced muscle strength and a longer 10 m walk test time in young, ambulant patients with DMD; both of which are primary outcome measures in clinical trials. We have developed a double knockout mouse model, which also shows reduced muscle strength, but is protected from stretch-induced eccentric damage with age. This suggests that α-actinin-3 deficiency reduces muscle performance at baseline, but ameliorates the progression of dystrophic pathology. Mechanistically, we show that α-actinin-3 deficiency triggers an increase in oxidative muscle metabolism through activation of calcineurin, which likely confers the protective effect. Our studies suggest that ACTN3 R577X genotype is a modifier of clinical phenotype in DMD patients.


Conflict of interest statement

E.P.H. has served on advisory committees for AVI BioPharma, Inc., as a consultant with the Gerson Lehman Group, Medacorp, and Lazard Capital, and is cofounder, board member, and shareholder of ReveraGen Biopharma. The remaining authors declare no competing financial interests.

Figures
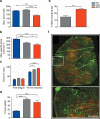
Figure 1
Figure 1. Baseline muscle physiology from 8 week old mice.
(a) dKO muscles produce ∼33% less force than mdx controls (mdx - 204.9 mN, dKO - 138.3 mN, P<0.001). (b) When corrected for cross-sectional area, dKO muscles produce significantly less maximum specific force than mdx. (c) Both mdx and dKO show significantly greater recovery from fatigue than WT, but no difference was observed between mdx and dKO. (d) dKO muscles suffer slightly less damage than mdx controls following a series of 6 20% eccentric contractions (mdx 45% drop in force following eccentric contractions, dKO 38%, P=0.08). A subset of the WT EDL muscle physiology data was previously published in Hogarth et al. (e) A higher percentage of gastrocnemius muscle fibres are EBD-positive following a downhill run in dKO mice than mdx. (f) Representative cross-section from a dKO gastrocnemius following downhill run. EBD positive fibres are shown in red and wheat germ agglutinin (Green) was used to delineate the fibre border. Scale bar indicates 500 μm. Data shown as mean±s.e.m., One-way ANOVA, *P<0.05, **P<0.01, ***P<0.001. WT n=11, mdx n=16, dKO n=11.
Figure 2
Figure 2. Muscle physiology from 12 month old mice.
(ad) Ex vivo EDL muscle function. (a) dKO muscles produce ∼27% less force than mdx controls (mdx – 171.0 mN, dKO – 126.2 mN, One-way ANOVA, P<0.001). (b) When corrected for cross-sectional area, dKO muscles produce significantly less maximum specific force than mdx. (c) dKO muscles suffer less damage than mdx controls following a series of three 15% eccentric contractions (mdx - 71% drop in force following eccentric contractions, dKO - 47%, One-way ANOVA, P<0.01). (d) dKO show significantly greater recovery from fatigue compared with WT, and mdx. (e,f) In situ TA muscle function replicates the phenotype seen in the EDL. (e) dKO muscles produce ∼25% less force than mdx controls (mdx - 1613 mN, dKO-1221 mN, One-way ANOVA, P<0.01), (f) After correction for cross-sectional area, dKO show reduced specific force compared with mdx. Both are significantly reduced compared with WT. (g) Both mdx and dKO muscles are significantly injured compared with WT by eccentric contractions of increasing strain (Multiple T-test, FDR 1% #P <0.01), but dKO muscles suffer less damage than mdx between 25-30% LO (0–35%; mdx – 80% drop in force following eccentric contractions, dKO 65%, Multiple T-test, FDR 1%, P<0.05). Data shown as mean±s.e.m., One-way ANOVA, *P<0.05, **P<0.01, ***P<0.001, WT n=5, mdx n=6, dKO n=6.
Figure 3
Figure 3. Muscle pathology from aged mdx and dKO mice.
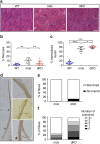
(a) Hematoxylin and eosin (H&E) stained TA sections from WT, mdx and dKO mice. Scale bar indicates 100 μm. (b) dKO muscles showed a significant reduction in total necrotic area compared with mdx (mdx – 10.7% versus dKO – 4.7%). (c) Both mdx and dKO show an increase in centrally nucleated fibres compared with WT, and dKO show a further increase compared with mdx (dKO – 79% versus mdx 71%, P<0.05). Data shown as mean±s.e.m., One-way ANOVA, *P<0.05, **P<0.01, ***P<0.001. WT n=11, mdx n=12, dKO n=11. (d) Individual fibres were isolated from 12 month old EDLs to assess fibre branching. The left hand panel shows an entire intact fibre from mdx with a branch which originates from the main body of the fibre which re-joins at the mid-belly of the fibre (indicated by arrows). The right hand panels show higher magnification examples of fibre branching. Scale bar indicates 100 μm. (e) Almost all fibres isolated from mdx (99%) and dKO (89%) are branched. (f) However, mdx show a higher number of branches per fibre than dKO; 74% of mdx fibres have 4 or more branches compared with 18% of dKO. Fibre counts are pooled (n=3 mice per genotype) with ∼600 fibres analysed per genotype.
Figure 4
Figure 4. Longitudinal analysis of the CINRG cohort.
(a) Kaplan-Meier survival analysis for age at loss of ambulation (LoA) in 266 CINRG Duchenne Natural history Study participants. Heterozygous (RX) participants suffered 1- to 2-year earlier LoA with a median age of 11.7 years (95% CI 11.0–13.0), as opposed to 12.5 (11.1–14.0) in RR and 13.0 (11.9–14.0) in XX. (b) Longitudinal analysis of grip QMT in steroid-treated 6 to 10 year old DMD patients. They are not necessarily the same subjects throughout the 48 month period of testing. Some subjects only met the criteria in the middle of the study and others were only included in the analysis for a few time points. Error bars represent mean±95% CI.
Figure 5
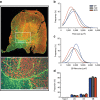
Figure 5. Fibre size is reduced in dKO mice.
(a) Representative image of fibre typing in WT quadriceps. Sections cut from the midbelly of 12 month old male quadriceps were stained with antibodies against MyHC Type 1 (green), 2A (blue) and 2B (red), while 2X fibres were left unstained. A488 conjugated wheat germ agglutinin was used to mark membranes to delineate the individual fibres (Green). Scale bar indicates 500 μm. (b) Fibre size frequency distribution for all quadriceps fibres (Approx 7,000 per quadriceps). The mean fibre size was reduced in dKO compared with mdx (1781±158 μm2 versus 1223±242 μm2, P<0.05). (c) Frequency distribution for all 2B fibres in the quadriceps. Mean 2B fibre size is reduced in dKO compared with WT (1950±213 μm2 versus 1670±267 μm2, P<0.05). (d) Individual fibre types presented as a percentage of total fibre number show no shift in fibre type proportion across all the genotype groups. Data shown as mean±s.e.m., WT n=6, mdx n=7, dKO n=6.
Figure 6
Figure 6. Relative protein expression in dKO muscle compared to mdx.
(a,b) dKO muscle at 12-months of age show a compensatory upregulation of α-actinin-2 for the loss of α-actinin-3 and a ∼2.4-fold upregulation in RCAN1.4, but no change in the level of utrophin. (c,d) No significant differences in the expression of total and phosphorylated ACC, and total and phosphorylated AMPK were observed, but dKO mice did show a trend for increased expression of each. (e,f) dKO muscle shows an increase in oxidative metabolism as evidenced by significant upregulation in ATP synthase (ATPase), succinate-Q oxidoreductase (Complex II), cytochrome-c oxidoreductase (Complex III) and cytochrome c oxidase (Complex IV). Graphs b,d and f represent relative OD levels normalized to actin and mdx. Data shown as mean±SEM, One-way ANOVA, *P< 0.05. mdx n=4, dKO n=4. Full-length blots are presented in Supplementary Fig. 6.

References

    1. Hoffman E. P., Brown R. H. Jr & Kunkel L. M. Dystrophin: the protein product of the Duchenne muscular dystrophy locus. Cell 51, 919–928 (1987). - PubMed
    1. Bushby K., Muntoni F., Urtizberea A., Hughes R. & Griggs R. Report on the 124th ENMC International Workshop. Treatment of Duchenne muscular dystrophy; defining the gold standards of management in the use of corticosteroids 2–4 April 2004, Naarden, the Netherlands. Neuromusc. Disord. 14, 526–534 (2004). - PubMed
    1. Moxley R. T. et al. Practice parameter: corticosteroid treatment of Duchenne dystrophy. Neurology 64, 13–20 (2005). - PubMed
    1. Desguerre I. et al. Clinical heterogeneity of Duchenne muscular dystrophy (DMD): definition of sub-phenotypes and predictive criteria by long-term follow-up. PLoS ONE 4, e4347 (2009). - PMC - PubMed
    1. Pegoraro E. et al. SPP1 genotype is a determinant of disease severity in Duchenne muscular dystrophy. Neurology 76, 219–226 (2011). - PMC - PubMed

Publication types

MeSH terms

Substances

LinkOut - more resources