

Coevolutionary dynamics of phenotypic diversity and contingent cooperation
- PMID: 28141806
- PMCID: PMC5308777
- DOI: 10.1371/journal.pcbi.1005363
Coevolutionary dynamics of phenotypic diversity and contingent cooperation
Abstract
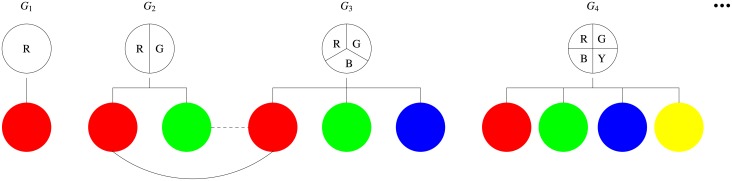
Phenotypic diversity is considered beneficial to the evolution of contingent cooperation, in which cooperators channel their help preferentially towards others of similar phenotypes. However, it remains largely unclear how phenotypic variation arises in the first place and thus leads to the construction of phenotypic complexity. Here we propose a mathematical model to study the coevolutionary dynamics of phenotypic diversity and contingent cooperation. Unlike previous models, our model does not assume any prescribed level of phenotypic diversity, but rather lets it be an evolvable trait. Each individual expresses one phenotype at a time and only the phenotypes expressed are visible to others. Moreover, individuals can differ in their potential of phenotypic variation, which is characterized by the number of distinct phenotypes they can randomly switch to. Each individual incurs a cost proportional to the number of potentially expressible phenotypes so as to retain phenotypic variation and expression. Our results show that phenotypic diversity coevolves with contingent cooperation under a wide range of conditions and that there exists an optimal level of phenotypic diversity best promoting contingent cooperation. It pays for contingent cooperators to elevate their potential of phenotypic variation, thereby increasing their opportunities of establishing cooperation via novel phenotypes, as these new phenotypes serve as secret tags that are difficult for defector to discover and chase after. We also find that evolved high levels of phenotypic diversity can occasionally collapse due to the invasion of defector mutants, suggesting that cooperation and phenotypic diversity can mutually reinforce each other. Thus, our results provide new insights into better understanding the coevolution of cooperation and phenotypic diversity.
Conflict of interest statement
The authors have declared that no competing interests exist.
Figures


Similar articles
-
Evolution of joint cooperation under phenotypic variations.Sci Rep. 2018 Mar 7;8(1):4137. doi: 10.1038/s41598-018-22477-5. Sci Rep. 2018. PMID: 29515138 Free PMC article.
-
Phenotype affinity mediated interactions can facilitate the evolution of cooperation.J Theor Biol. 2019 Feb 7;462:361-369. doi: 10.1016/j.jtbi.2018.11.026. Epub 2018 Nov 27. J Theor Biol. 2019. PMID: 30496745
-
Evolution of cooperation in a multidimensional phenotype space.Theor Popul Biol. 2015 Jun;102:60-75. doi: 10.1016/j.tpb.2015.03.007. Epub 2015 Apr 3. Theor Popul Biol. 2015. PMID: 25847145
-
Individual variation behind the evolution of cooperation.Philos Trans R Soc Lond B Biol Sci. 2016 Feb 5;371(1687):20150087. doi: 10.1098/rstb.2015.0087. Philos Trans R Soc Lond B Biol Sci. 2016. PMID: 26729927 Free PMC article. Review.
-
Variation and the response to variation as a basis for successful cooperation.Philos Trans R Soc Lond B Biol Sci. 2010 Sep 12;365(1553):2627-33. doi: 10.1098/rstb.2010.0159. Philos Trans R Soc Lond B Biol Sci. 2010. PMID: 20679107 Free PMC article. Review.
Cited by
-
Synergistic third-party rewarding and punishment in the public goods game.Proc Math Phys Eng Sci. 2019 Jul;475(2227):20190349. doi: 10.1098/rspa.2019.0349. Epub 2019 Jul 24. Proc Math Phys Eng Sci. 2019. PMID: 31423104 Free PMC article.
-
Evolution of joint cooperation under phenotypic variations.Sci Rep. 2018 Mar 7;8(1):4137. doi: 10.1038/s41598-018-22477-5. Sci Rep. 2018. PMID: 29515138 Free PMC article.
-
Punishment and inspection for governing the commons in a feedback-evolving game.PLoS Comput Biol. 2018 Jul 20;14(7):e1006347. doi: 10.1371/journal.pcbi.1006347. eCollection 2018 Jul. PLoS Comput Biol. 2018. PMID: 30028836 Free PMC article.
-
Close spatial arrangement of mutants favors and disfavors fixation.PLoS Comput Biol. 2019 Sep 16;15(9):e1007212. doi: 10.1371/journal.pcbi.1007212. eCollection 2019 Sep. PLoS Comput Biol. 2019. PMID: 31525178 Free PMC article.
References
Publication types
MeSH terms
LinkOut - more resources
Full Text Sources
Other Literature Sources
