. 2017 Feb 1;18(1):13.
doi: 10.1186/s13059-016-1144-4.

Single Cas9 nickase induced generation of NRAMP1 knockin cattle with reduced off-target effects

Affiliations

Single Cas9 nickase induced generation of NRAMP1 knockin cattle with reduced off-target effects

Yuanpeng Gao et al. Genome Biol. .

Abstract

Background: The CRISPR-Cas9 system is a widely utilized platform for transgenic animal production in various species, although its off-target effects should be addressed. Several applications of this tool have been proposed in model animals but remain insufficient for transgenic livestock production.

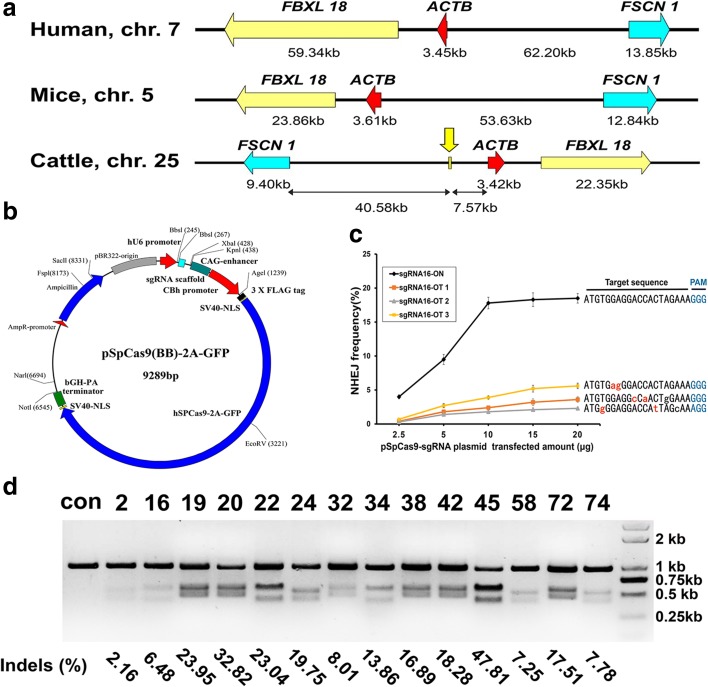
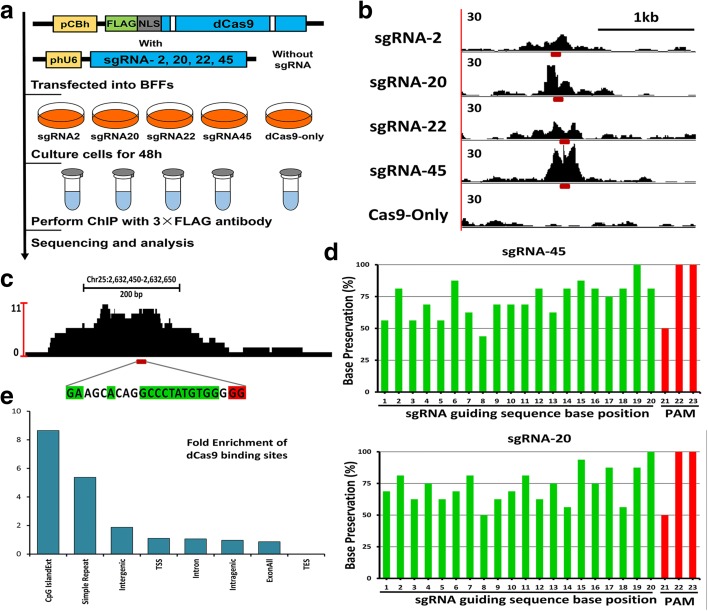
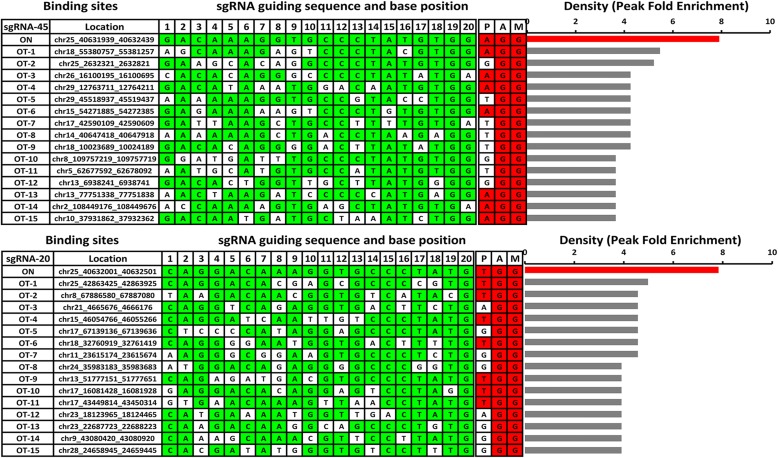
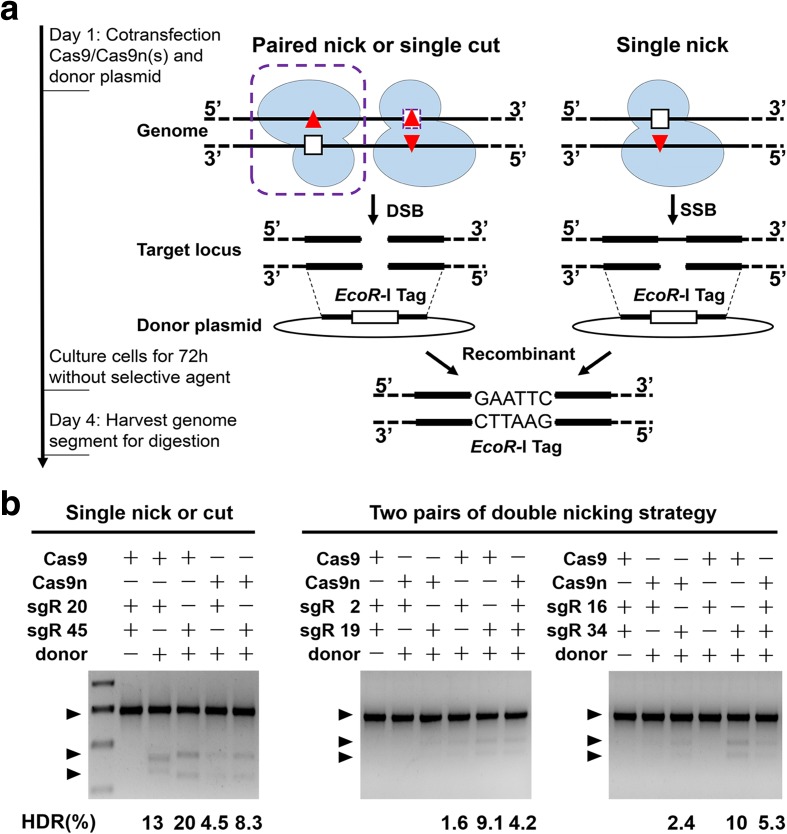
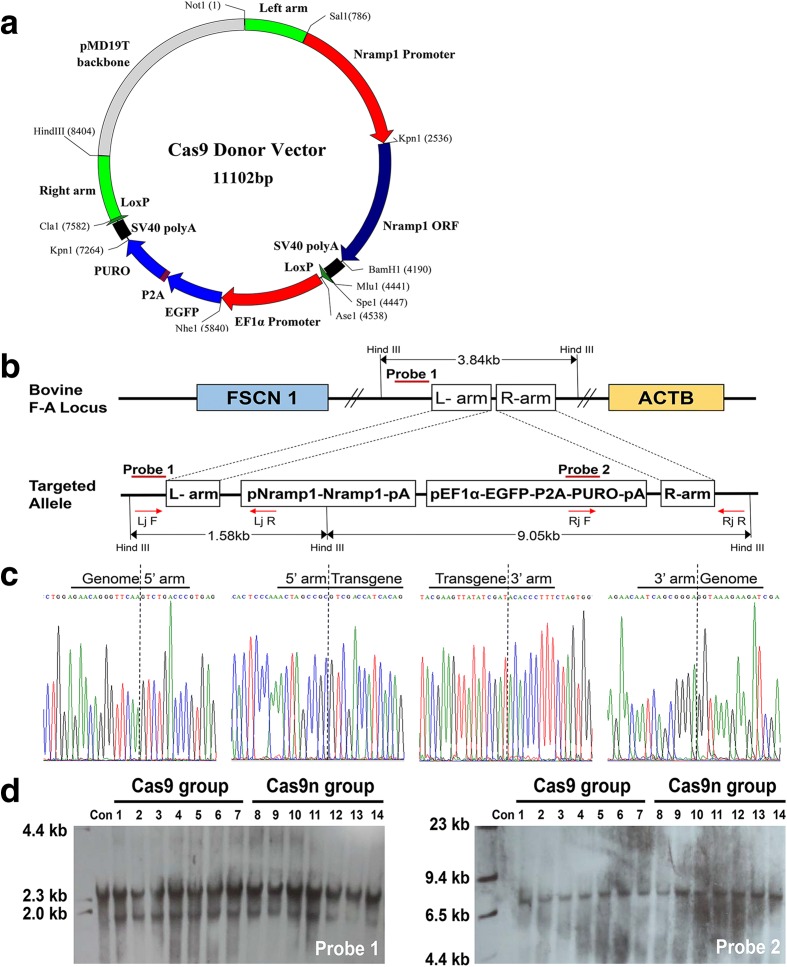
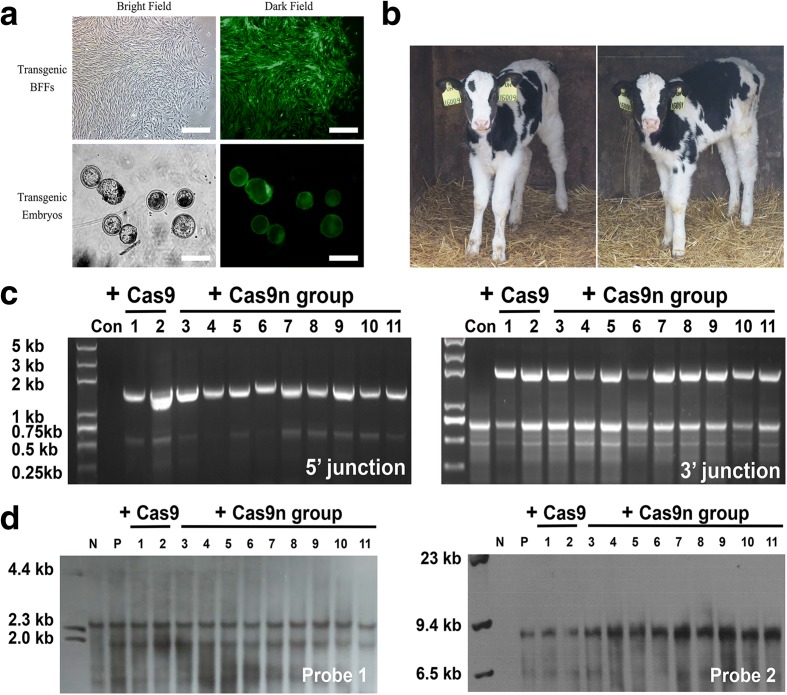
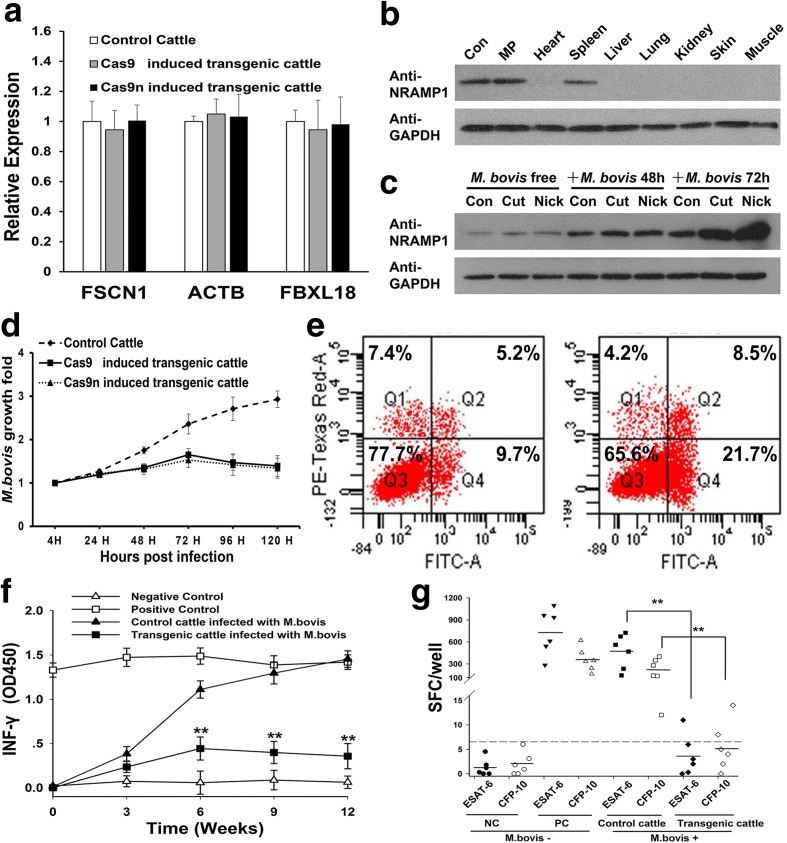
Results: Here, we report the first application of single Cas9 nickase (Cas9n) to induce gene insertion at a selected locus in cattle. We identify the main binding sites of a catalytically inactive Cas9 (dCas9) protein in bovine fetal fibroblast cells (BFFs) with chromatin immunoprecipitation sequencing (ChIP-seq). Subsequently, we demonstrate that a single Cas9n-induced single-strand break can stimulate the insertion of the natural resistance-associated macrophage protein-1 (NRAMP1) gene with reduced, but still considerable, off-target effects. Through somatic cell nuclear transfer, we finally obtain transgenic cattle with increased resistance to tuberculosis.

Conclusions: Our results contribute to the development of CRISPR-Cas9 system for agriculture applications.

Keywords: CRISPR-Cas9; Chromatin immunoprecipitation sequencing (ChIP-seq); Homologous recombination; Nickase; Off-target; Single-strand break; Tuberculosis.


Figures

Fig. 1
Fig. 1
F-A locus and target site selection. a The molecular structures of the human, mouse, and cattle F-A loci were highly conserved. b Schematic representation of the plasmid encoding both hSpCas9 expression and sgRNA transcription. Different sgRNAs were cloned for the corresponding target sites through the two neighboring BbsI restriction enzyme sites. c Concentration-dependent cleavage activity and the amount of pSpCas9 DNA transfected. The three potential off-target sites were selected with Cas-OFFinder based on fewer than three mismatches and the NHEJ frequency was determined by a Surveyor nuclease assay. d Cleavage efficiencies of the Cas9 protein at the selected target sites. “Con” represents the DNA isolated from BFFs transfected with Cas9 only (without sgRNA). The degree of cleavage was quantified with Surveyor nuclease assays and ImageJ (http://imagej.net). The formula for estimating the indel rate is provided in the “Methods” section
Fig. 2
Fig. 2
Process and characteristics of dCas9 binding in BFFs. a Schematic representation of the dCas9 ChIP-seq approach applied to the BFFs. The four 3 × FLAG-tagged Cas9-encoding plasmids with different sgRNAs were considered different experimental groups (left) and the same plasmid but without sgRNA was used for the dCas9-only control (right). b Visualization of the ChIP-seq peaks (normalized read counts) revealed that they were localized around four on-target sites and the control. The red dashes under each peak indicate the designed target sites. c Visualization of the ChIP-seq peak of one typical off-target region. The location of this region is shown above the peak. Bases matching the sgRNA guiding sequences and PAM sequences at the off-target sites are highlighted in green and red, respectively. d Percentages of preserved bases at the main off-target sites compared with the guiding sequences of sgRNA45 (above) and sgRNA 20 (below). e Performance of dCas9 in binding to the chromatin structure of the off-target binding site. “TSS” represents the 1 kb region centered on the transcription start site region; “TES” represents the same range of the transcription end site
Fig. 3
Fig. 3
Off-target sites of sgRNA 45 and 20 with the top 15 ChIP-seq binding densities. All of the off-target sites were computationally identified with 20 bp sequences. These sites ended with PAM and aligned most effectively with the sgRNA guiding sequences in each peak. OT indicates off-target; all of the off-target sites in the same group were ranked according to the ChIP-seq binding densities (peak fold enrichments) as illustrated in the bar graphs on the right. At the off-target sites, bases matching the sgRNA guiding sequence and the PAM sequence are highlighted in green and red, respectively. Similar results for sgRNA 2 and 20 are available in Additional file 3: Figure S3
Fig. 4
Fig. 4
Single Cas9n stimulated HDR at the F-A locus. a Experiential outline and schematic of the HDR process. The designed donor plasmid was recombined with the genome through single Cas9-induced DSB (left, without the purple frames), paired Cas9n-induced DSB (left, with the purple frames), and single Cas9n-induced SSB (right). b HDR frequency measurements of the different targeting strategies based on restriction enzyme tag integration. The specific numbers below each lane were calculated with the relative intensities of digested bands and the undigested band
Fig. 5
Fig. 5
Insertion and selection of the NRAMP1 transgenic colony using single Cas9 or Cas9n. a Schematic representation of the gene-targeting donor vector. b Schematic overview of the screening of the individual colonies. Lj F and Rj R were the primers for the regions outside the homologous arms, and Lj R and Rj F were the primers for the donor vector region. Southern blot probes are shown as red lines and Hind III digestion was used in the southern blot analysis. c Sanger sequencing confirming the precise insertion of the exogenous DNA. d Southern blot analysis of the donor cells used for SCNT. Non-transfected BFFs were used for negative controls. A 1.58 kb band resulting from the targeted insertion of the NRAMP1 cassette was detected in addition to the 3.84 kb band from the endogenous F-A locus allele when probe 1 was used. A 9.05 kb targeted band was also detected with probe 2
Fig. 6
Fig. 6
Assessment of the transgenic cattle. a Transgenic colony after positive drug selection and transgenic embryos from SCNT under a fluorescence stereomicroscope. b Photographs of one-month-old calves that carried the NRAMP1 insertion. c The 5′ (left, 1.58 kb) and 3′ junction (right, 1.98 kb) PCR analyses confirming the site-specific targeting in the transgenic cattle. “Con” represents the control normal cattle. The templates for PCR were genomic DNA samples that were extracted from the peripheral blood of cattle. d Southern blot analysis of the genomic DNA extracted from transgenic cattle. “N” represents the negative control normal cattle; “P” represents the positive transgenic BFFs
Fig. 7
Fig. 7
Assessment of the increased resistance of the transgenic cattle to tuberculosis. a The relative expression levels of the nearby endogenous genes in the F-A locus. Each sample was individually detected in macrophages through real-time PCR, but the data were analyzed according to the group. b The expression of NRAMP1 was restricted to dedicated phagocytes. The organs were obtained from a pool of dead transgenic cattle. Con, NRAMP1 over-expression Raw264.7 cells; MP macrophages. c The expression of NRAMP1 was highly activated in the transgenic cattle following infection. All the samples were mixed monocyte-derived macrophages (MDMs) that were isolated from the blood of the same group of cattle as a pool. “Con” represents the control normal cattle. d Multiplication of M. bovis in MDMs from the control or transgenic cattle in vitro. The MDMs were separated from each animal individually and mixed according to group. M. bovis multiplication was determined via cfu assays. e Flow cytometry analysis of the cell death mechanism of the transgenic cattle MDMs after M. bovis infection. Necrotic (Q1), early apoptotic (Q2), and late apoptotic (Q4). Left, infected experiment control MDMs. Right, infected transgenic MDMs. f Amounts of IFN-γ produced in the experimental control (n = 6) and transgenic (n = 6) cattle at regular intervals of 12 weeks. g Concentrations of ESAT-6 and CFP-10 IFN-γ–producing SFCs among the PBMCs of the control and transgenic cattle

References

    1. Filippo JS, Sung P, Klein H. Mechanism of eukaryotic homologous recombination. Annu Rev Biochem. 2008;77:229–57. doi: 10.1146/annurev.biochem.77.061306.125255. - DOI - PubMed
    1. Meyer M, de Angelis MH, Wurst W, Kuhn R. Gene targeting by homologous recombination in mouse zygotes mediated by zinc-finger nucleases. Proc Natl Acad Sci U S A. 2010;107:15022–6. doi: 10.1073/pnas.1009424107. - DOI - PMC - PubMed
    1. Sommer D, Peters A, Wirtz T, Mai M, Ackermann J, Thabet Y, et al. Efficient genome engineering by targeted homologous recombination in mouse embryos using transcription activator-like effector nucleases. Nat Commun. 2014;5:3045. doi: 10.1038/ncomms4045. - DOI - PubMed
    1. Hockemeyer D, Wang HY, Kiani S, Lai CS, Gao Q, Cassady JP, et al. Genetic engineering of human pluripotent cells using TALE nucleases. Nat Biotechnol. 2011;29:731–4. doi: 10.1038/nbt.1927. - DOI - PMC - PubMed
    1. Katz SS, Gimble FS, Storici F. To nick or not to nick: comparison of I-scei single- and double-strand break-induced recombination in yeast and human cells. PLoS One. 2014;9:e88840. doi: 10.1371/journal.pone.0088840. - DOI - PMC - PubMed

Publication types

MeSH terms

Substances