. 2017 Mar 1;25(3):570-579.
doi: 10.1016/j.ymthe.2016.12.023. Epub 2017 Jan 28.

Engineering HIV-Resistant, Anti-HIV Chimeric Antigen Receptor T Cells

Affiliations

Engineering HIV-Resistant, Anti-HIV Chimeric Antigen Receptor T Cells

Malika Hale et al. Mol Ther. .

Abstract

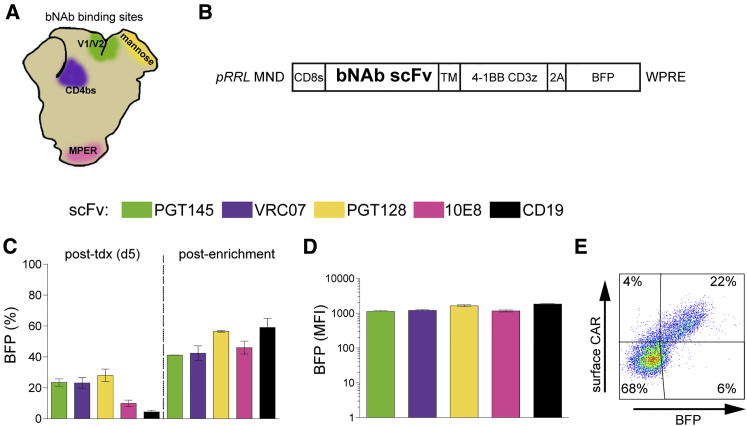
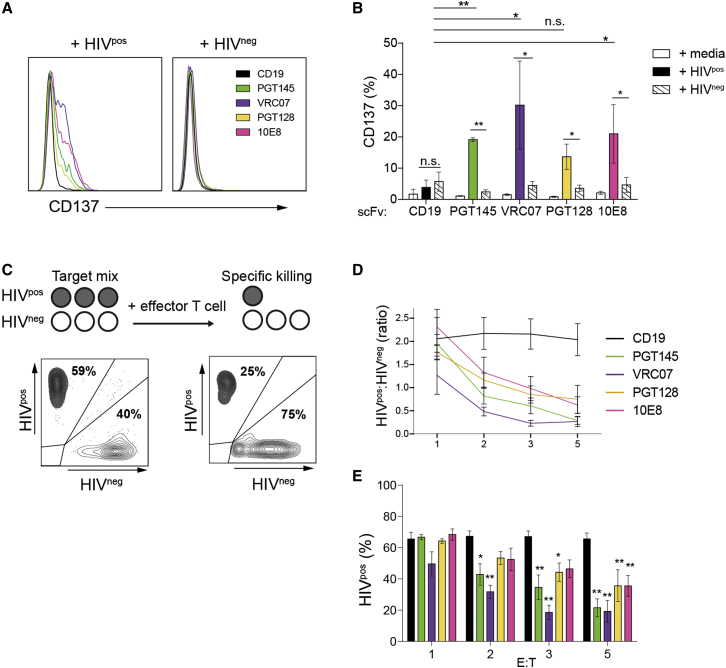
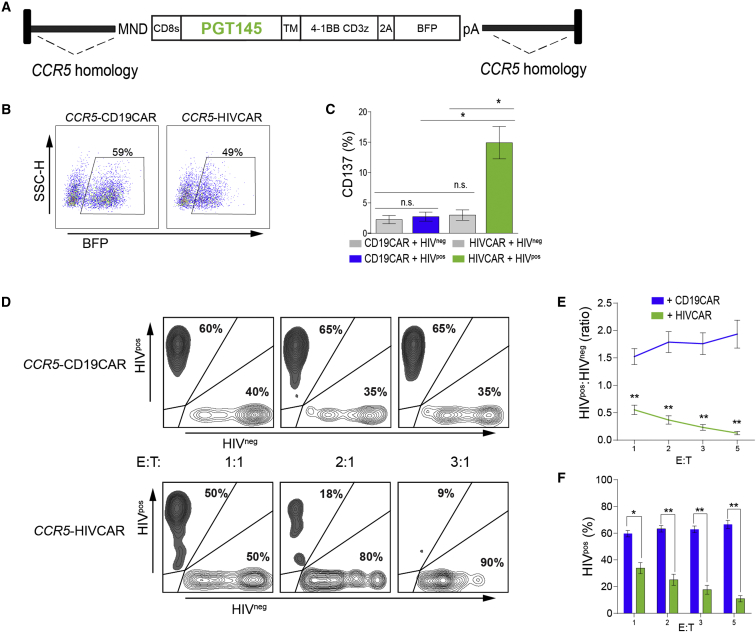
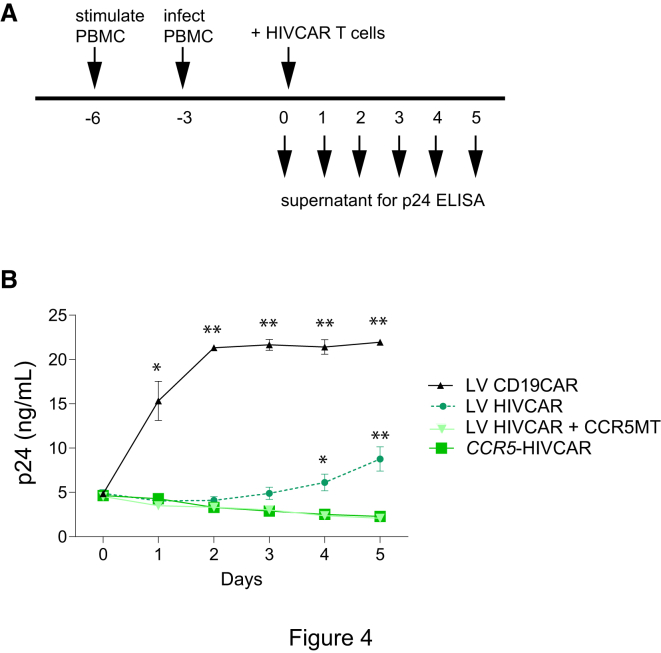
The treatment or cure of HIV infection by cell and gene therapy has been a goal for decades. Recent advances in both gene editing and chimeric antigen receptor (CAR) technology have created new therapeutic possibilities for a variety of diseases. Broadly neutralizing monoclonal antibodies (bNAbs) with specificity for the HIV envelope glycoprotein provide a promising means of targeting HIV-infected cells. Here we show that primary human T cells engineered to express anti-HIV CARs based on bNAbs (HIVCAR) show specific activation and killing of HIV-infected versus uninfected cells in the absence of HIV replication. We also show that homology-directed recombination of the HIVCAR gene expression cassette into the CCR5 locus enhances suppression of replicating virus compared with HIVCAR expression alone. This work demonstrates that HIV immunotherapy utilizing potent bNAb-based single-chain variable fragments fused to second-generation CAR signaling domains, delivered directly into the CCR5 locus of T cells by homology-directed gene editing, is feasible and effective. This strategy has the potential to target HIV-infected cells in HIV-infected individuals, which might help in the effort to cure HIV.

Keywords: CAR T cell; HIV; cell therapy; chimeric antigen receptor; gene editing.


Figures

Figure 1
Figure 1
HIVCARs Based on bNAb Are Expressed on the Surface of Primary Human T Cells (A) Known binding site for each bNAb scFv used indicated by color on a diagram of the HIV envelope. V1/V2, variable loops 1 and 2; mannose, high-mannose patch; CD4bs, CD4 binding site; MPER, membrane proximal external region. (B) Schematic diagram of the CAR construct in the pRRL LV backbone containing the γ-retrovirus-derived promoter-enhancer MND. scFvs from various bNAbs (indicated by colored boxes below) were cloned upstream of the hinge region. CD8s, CD8-signaling domain; TM, CD8 trans-membrane domain; 4-1BB CD3z, intracellular signaling domains of second-generation CAR; 2A, self-cleaving 2A peptide. (C) Percentage of BFP+ human primary CD3+ cells 5 days after LV transduction (tdx), and 8 days after enrichment by fluorescence-activated cell sorting (FACS). (D) MFI of BFP+ cells 8 days after enrichment. The bars in (C) and (D) show the mean ± SEM of n = 3 human cell donors. The same three donors were used for replicate transduction of each LV. (E) Representative flow plot showing surface CAR expression on primary human T cells transduced with pRRL MND VRC07-523-CAR T2A BFP.
Figure 2
Figure 2
Responses of HIVCAR T Cells to HIV-Infected Cells Are scFv-Specific (A) Histograms showing CD137 expression on BFP+ CAR T cells 24 hr after mixing with either HIVpos or HIVneg target T cell lines. Shown are representative data from one of three independent donors. (B) Summary of CD137 expression in BFP+ CAR T cells generated from three donors incubated either with medium alone or HIVpos or HIVneg target T cell lines. (C) Schematic of the cytotoxicity assay and representative plots of two target cell populations before and after HIVCAR T cell treatment. (D) Ratio of HIVpos to HIVneg live target cells at 48 hr in wells plated with PGT145, VRC07-523, PGT128, 10E8, and CD19CAR T cells at increasing E:T ratios. (E) Percent of HIVpos target cells of total live target cells remaining 48 hr after plating with effector CAR T cells at increasing E:T ratios. The significance shown is versus anti-CD19CAR at each E:T ratio. For all charts, bars show the mean ± SEM of three unique experiments. p values were obtained using the Tukey method for ANOVA for multiple comparisons. *p < 0.05; **p < 0.001; n.s., not significant.
Figure 3
Figure 3
Effector T Cells Generated by Targeted Integration of an HIVCAR Cassette into CCR5 Retain HIV-Specific Activation and Lysis Capacity (A) Map of the AAV6 vector for HDR targeting of the PGT145-CAR expression cassette to human CCR5. CCR5 homology arms are approximately 0.6 kb. (B) Flow plots showing expression of cis-linked BFP in sort-enriched CCR5-CAR T cells used in functional assays. (C) Percentage of CCR5-HIVCAR T cells that express CD137 24 hr after stimulation with HIVpos (colored) or HIVneg (gray) T cell lines compared with activity of CCR5-CD19 CAR T cells in an identical setting. (D) Representative flow plots of the target cell mix 48 hr after plating at increasing E:T ratios with CCR5-CD19 or CCR5-HIVCAR T cells. Percentages shown are percent GFP+ (HIVpos target cell line) or mCherry+ (HIVneg target cell line) from a gate that excludes BFP+ (effector) and double-negative cells. (E) Ratio of HIVpos (GFP) to HIVneg (mCherry) live target cells at increasing E:T ratios, performed in triplicate. (F) Percentage of total target cells that are HIVpos as measured by GFP expression. The significance shown is a t test comparison of CD19CAR versus HIVCAR T cells at each E:T ratio. Shown are mean ± SEM for n = 5 (C) of three (E and F) unique experiments using CAR T cells generated from three independent human donors. p values calculated using unpaired two-tailed t test are indicated as follows: *p < 0.05, **p < 0.001.
Figure 4
Figure 4
CCR5 Disruption of HIVCAR T Cells Improves Viral Control In Vitro (A) Live virus challenge of CAR T cells during a 5-day co-culture with HIV-infected allogenic PBMCs. (B) p24 concentration in supernatant plotted over time. p values were obtained using the Tukey method for ANOVA for multiple comparisons. The significance shown is a comparison of each condition versus CCR5-HIVCAR. *p < 0.05, **p < 0.001. Error bars show ± SEM, n = 4 (each n is the average of duplicate samples) using T cells from two donors.

Comment in

  • HIV Receives a "One Two Knockout Punch".
    Cruz CR, Bollard CM. Cruz CR, et al. Mol Ther. 2017 Mar 1;25(3):566-567. doi: 10.1016/j.ymthe.2017.02.001. Epub 2017 Feb 8. Mol Ther. 2017. PMID: 28189492 Free PMC article. No abstract available.

References

    1. Joint United Nations Programme on HIV/AIDS (UNAIDS) (2016). Global AIDS Response Progress Reporting. https://aidsreportingtool.unaids.org/static/docs/GARPR_Guidelines_2016_E....
    1. Palella F.J., Jr., Baker R.K., Moorman A.C., Chmiel J.S., Wood K.C., Brooks J.T., Holmberg S.D., HIV Outpatient Study Investigators Mortality in the highly active antiretroviral therapy era: changing causes of death and disease in the HIV outpatient study. J. Acquir. Immune Defic. Syndr. 2006;43:27–34. - PubMed
    1. Deeken J.F., Tjen-A-Looi A., Rudek M.A., Okuliar C., Young M., Little R.F., Dezube B.J. The rising challenge of non-AIDS-defining cancers in HIV-infected patients. Clin. Infect. Dis. 2012;55:1228–1235. - PMC - PubMed
    1. Triant V.A., Josephson F., Rochester C.G., Althoff K.N., Marcus K., Munk R., Cooper C., D’Agostino R.B., Costagliola D., Sabin C.A. Adverse outcome analyses of observational data: assessing cardiovascular risk in HIV disease. Clin. Infect. Dis. 2012;54:408–413. - PMC - PubMed
    1. Mothobi N.Z., Brew B.J. Neurocognitive dysfunction in the highly active antiretroviral therapy era. Curr. Opin. Infect. Dis. 2012;25:4–9. - PubMed

Publication types

MeSH terms