. 2017 Jan 15;31(2):172-183.
doi: 10.1101/gad.290635.116. Epub 2017 Jan 31.

The senescence-associated secretory phenotype induces cellular plasticity and tissue regeneration

Affiliations

The senescence-associated secretory phenotype induces cellular plasticity and tissue regeneration

Birgit Ritschka et al. Genes Dev. .

Abstract

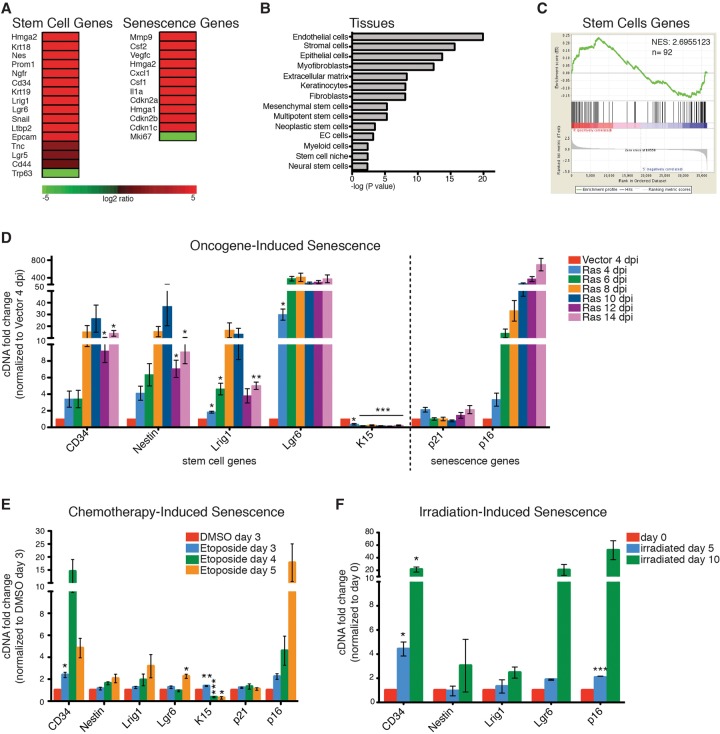
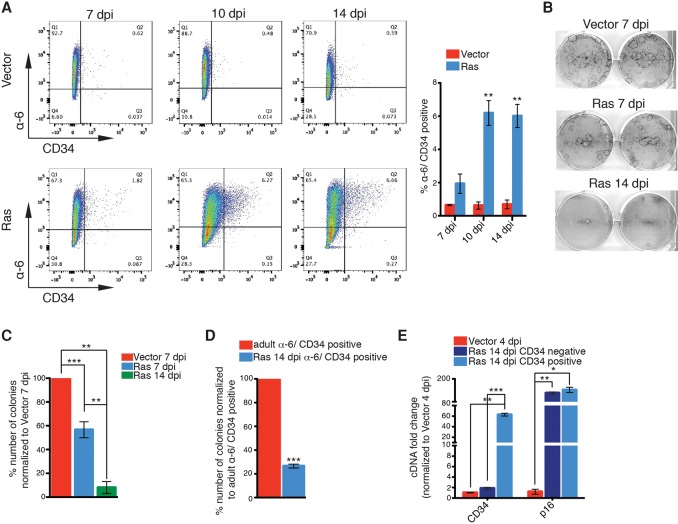
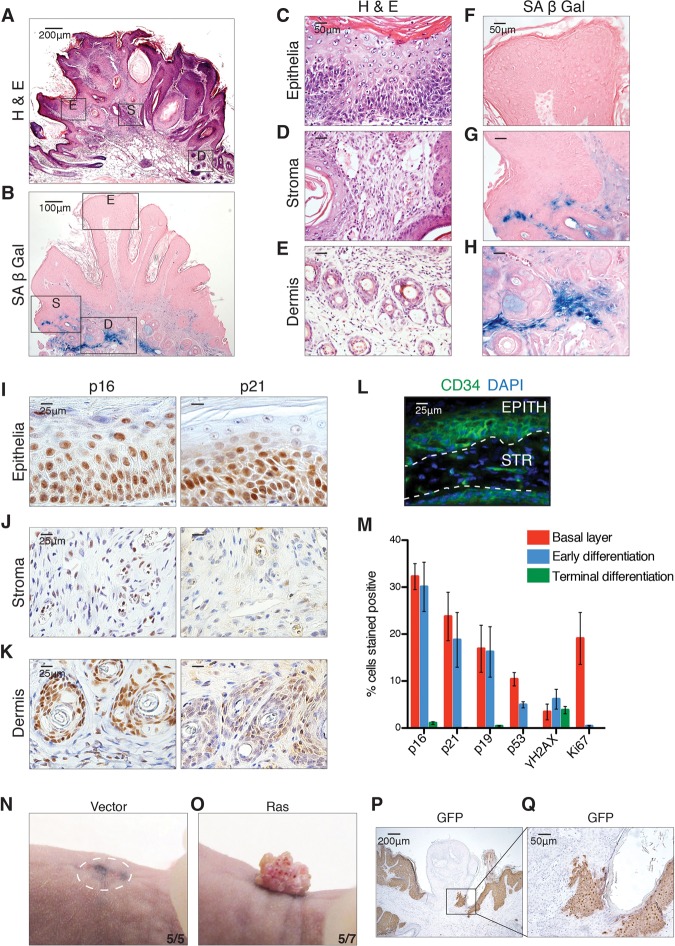
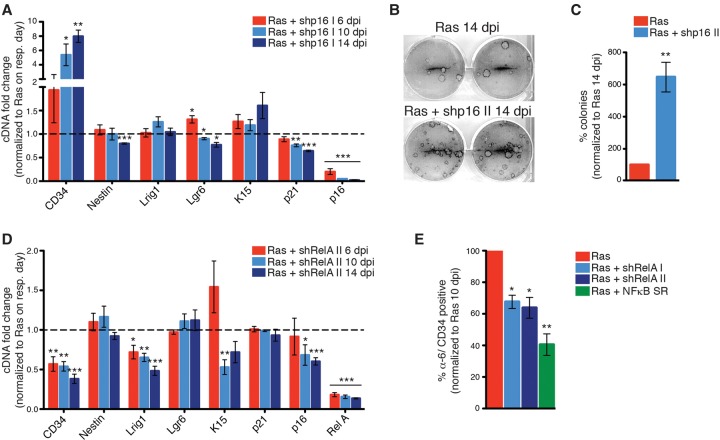
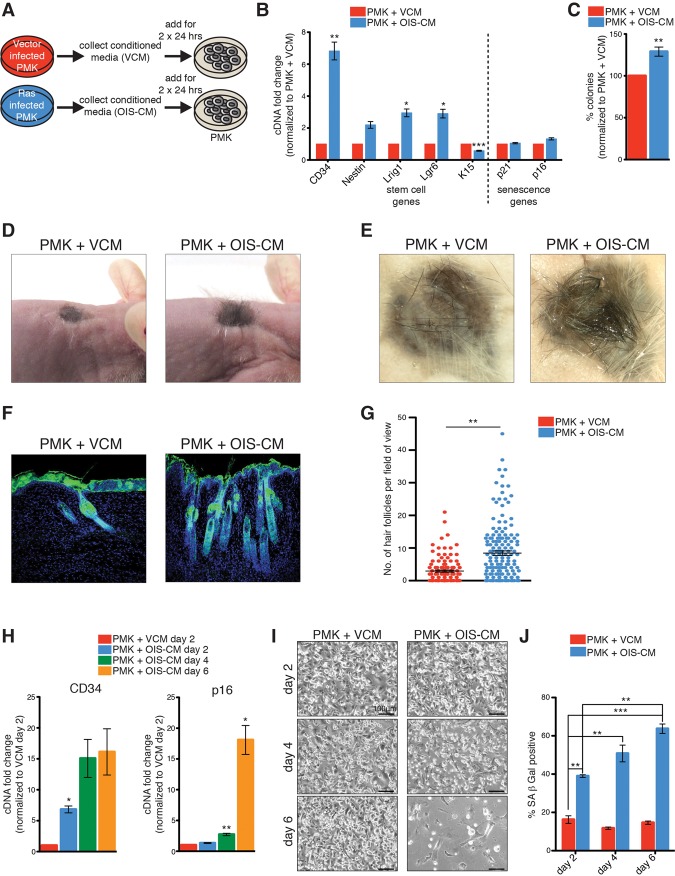
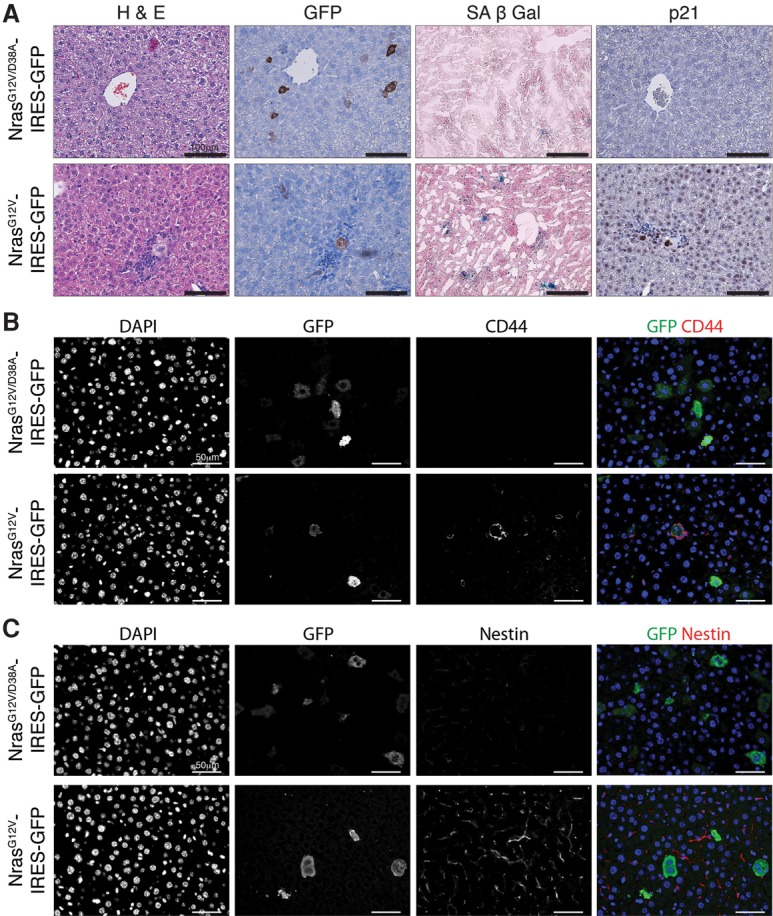
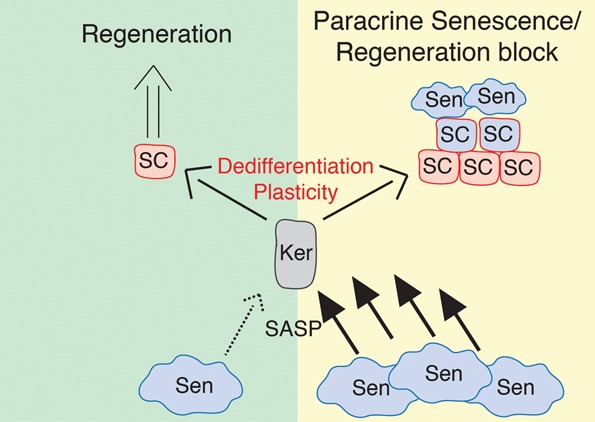
Senescence is a form of cell cycle arrest induced by stress such as DNA damage and oncogenes. However, while arrested, senescent cells secrete a variety of proteins collectively known as the senescence-associated secretory phenotype (SASP), which can reinforce the arrest and induce senescence in a paracrine manner. However, the SASP has also been shown to favor embryonic development, wound healing, and even tumor growth, suggesting more complex physiological roles than currently understood. Here we uncover timely new functions of the SASP in promoting a proregenerative response through the induction of cell plasticity and stemness. We show that primary mouse keratinocytes transiently exposed to the SASP exhibit increased expression of stem cell markers and regenerative capacity in vivo. However, prolonged exposure to the SASP causes a subsequent cell-intrinsic senescence arrest to counter the continued regenerative stimuli. Finally, by inducing senescence in single cells in vivo in the liver, we demonstrate that this activates tissue-specific expression of stem cell markers. Together, this work uncovers a primary and beneficial role for the SASP in promoting cell plasticity and tissue regeneration and introduces the concept that transient therapeutic delivery of senescent cells could be harnessed to drive tissue regeneration.

Keywords: CD34; SASP; papilloma; plasticity; senescence; stem cells.


Figures

Figure 1.
Figure 1.
A stem cell signature is increased in senescent cells. (A) Representative heat map of microarray analysis of HRasV12-induced senescent keratinocytes compared with growing keratinocytes. Example genes are shown to illustrate that stem cell and senescent genes are more highly expressed in senescent cells compared with growing cells. (B) Bioinformatics analysis of genes significantly up-regulated in senescent cells (analysis performed using Genomatix software; full list of up-regulated and down-regulated genes is in Supplemental Table 1). (C) GSEA of stem cell genes (Blanpain et al. 2004) in the gene expression profile of Ras-induced senescent keratinocytes. (NES) Normalized enrichment score. (D) qPCR analysis for skin stem cell and senescence genes in Ras-infected keratinocytes at 4–14 d post-infection (dpi) normalized to vector-infected keratinocytes at 4 dpi. n = 4, except for 14 dpi (n = 3). (E) qPCR analysis of etoposide-treated keratinocytes 3–5 d after treatment normalized to DMSO-treated keratinocytes 3 d after treatment. n = 5, except for day 5 (n = 3). (F) qPCR analysis of irradiated keratinocytes (12 Gy) 5 and 10 d after irradiation normalized to keratinocytes before irradiation. n = 2. (DF) Error bars indicate mean ± SEM. (*) P < 0.05; (**) P < 0.01; (***) P < 0.001), two-tailed Student's t-test.
Figure 2.
Figure 2.
OIS induces de novo specification of stem cell fate. (A) Representative FACS plots and quantification for α6-integrin+/CD34+ stem cells in Ras- or vector-infected keratinocytes at 7, 10, and 14 dpi. n = 3. (B,C) Representative images of colony-forming assays of vector-infected keratinocytes at 7 dpi and Ras-infected keratinocytes at 7 and 14 dpi (B) and quantification of numbers of colonies of Ras-infected keratinocytes at 7 and 14 dpi normalized to colonies of vector-infected keratinocytes at 7 dpi (C). n = 5, except for 14 dpi (n = 3). (D) Quantification of the numbers of colonies of sorted α6-integrin+/CD34+ cells from Ras-infected keratinocytes at 14 dpi normalized to colonies of sorted α6-integrin+/CD34+ cells from adult epidermis. n = 3. (E) qPCR analysis of sorted α6-integrin+/CD34 and α6-integrin+/CD34+ from Ras-infected keratinocytes at 14 dpi normalized to vector-infected keratinocytes at 4 dpi. n = 2, except for CD34 (n = 3). (A,C,D,E) Error bars indicate mean ± SEM (*) P < 0.05; (**) P < 0.01; (***) P < 0.001, two-tailed Student's t-test.
Figure 3.
Figure 3.
Senescent epithelial cells display a stem cell signature in vivo. (A) Hematoxylin and eosin (H&E) staining of DMBA/TPA-induced papillomas. Boxed regions E (epithelia), S (stroma), and D (dermis) are representative of areas magnified in CE. Bars, 50 µm. (B) SA-β-Gal staining of papilloma. Boxed regions E (epithelia), S (stroma), and D (dermis) are representative of areas magnified in FH. Bars, 50 µm. Immunohistochemistry for the senescence markers p16 and p21 in the epithelia (I), stroma (J), and underlying dermis (K) of chemically induced papillomas. Bars, 25 µm. (L) Immunofluorescence for the epithelial stem cell marker CD34 and DAPI in chemically induced papillomas. (EPITH) Epithelia; (STR) stroma. Bar, 25 µm. (M) Distribution of senescence markers in DMBA/TPA papillomas. All images are representative of at least four biological replicates. (NQ) Nude mice were grafted with a combination of 4 × 10⁶ dermal fibroblasts and 3 × 10⁶ keratinocytes infected with either vector at 6 dpi (N) or Ras at 6 dpi (O). The number of mice is shown in the bottom right corner. (P) Representative immunohistochemistry for GFP. (Q) Magnification of the boxed region in P.
Figure 4.
Figure 4.
Loss of SASP regulator NFκB in senescent cells causes a decrease in stem cell gene expression. (A) qPCR analysis of Ras- and shp16 I-double-infected keratinocytes at 6, 10, and 14 dpi normalized to Ras- and vector-double-infected keratinocytes on the respective days. n = 3. (B,C) Representative colony-forming assay (B) and number of colonies (C) of Ras- and vector-double-infected and Ras- and shp16 II-double-infected keratinocytes at 14 dpi. n = 4. (D) qPCR analysis of Ras- and shRelA II-double-infected keratinocytes at 6, 10, and 14 dpi normalized to Ras- and vector-double-infected keratinocytes on the respective days. n = 3. (E) The number of α6-integrin+/CD34+ cells of Ras, shRelA I, shRelA II, and NFκB superrepressor (SR)-double-infected keratinocytes normalized to Ras- and vector-double-infected keratinocytes at 10 dpi. n = 3. (A,C,D,E) Error bars indicate mean ± SEM. (*) P < 0.05; (**) P < 0.01; (***) P < 0.001, two-tailed Student's t-test.
Figure 5.
Figure 5.
Transient exposure to the SASP induces stem cell function and tissue regeneration. (A) Scheme representing the strategy used to collect VCM or OIS-CM and subsequent treatment of freshly isolated keratinocytes. (B) qPCR analysis for stem cell and senescence genes on keratinocytes treated for 48 h with VCM or OIS-CM. n = 10. (C) Quantification of the numbers of colonies of keratinocytes treated for 48 h with VCM or OIS-CM. n = 4. (D,E) Representative skin grafts in nude mice that were grafted with a combination of 4 × 10⁶ dermal fibroblasts and 6 × 10⁶ keratinocytes from the β-actin-GFP reporter mouse following 48 h of exposure to VCM or OIS-CM. (F) Representative immunohistochemistry for GFP and DAPI on grafts in D and E. (G) Graph showing the number of hair follicles per field of view. Grafts were analyzed 21–23 d after implantation. n = 6 PMK + OIS-CM; n = 7 PMK + VCM. (H) qPCR analysis for CD34 and p16 on keratinocytes treated for 2–6 d with OIS-CM normalized to VCM at day 2. n = 5, except for OIS-CM day 6 (n = 4) and OIS-CM and VCM day 2 (n = 10). (I) Representative images of keratinocytes treated for 2, 4, and 6 d with VCM or OIS-CM. n = 5. Bars, 100 µm. (J) Quantification of SA-β-Gal-positive cells of keratinocytes treated for 2–6 d with VCM or OIS-CM. n = 4, except for VCM day 6 (n = 3) and VCM and OIS-CM day 4 (n = 2). (B,C,G,H,J) Error bars indicate mean ± SEM. (*) P < 0.05; (**) P < 0.01; (***) P < 0.001, two-tailed Student's t-test.
Figure 6.
Figure 6.
Induction of senescence in single cells in livers induces an increase in stem cell markers in the surrounding tissue of the liver. Representative histology of liver sections 6 d after delivery of control (NrasG12V/D38A-IRES-GFP) or mutant (NrasG12V-IRES-GFP) transposon constructs. (A) H&E staining, immunohistochemistry for GFP and p21, and SA-β-Gal staining. Bars, 100 µm. (B,C) Immunofluorescence for CD44, GFP, and DAPI (B) and Nestin, GFP, and DAPI (C). Bars, 50 µm. All images are representative of at least three biological replicates.
Figure 7.
Figure 7.
Schematic diagram illustrating transient and chronic exposure to SASP. Transient or low-level exposure to the SASP (dashed arrows) is beneficial, inducing plasticity and regeneration. However, prolonged or chronic exposure to the SASP (solid arrows) induces increased stemness, which is blocked by paracrine senescence arrest.

References

    1. Abel EL, Angel JM, Kiguchi K, DiGiovanni J. 2009. Multi-stage chemical carcinogenesis in mouse skin: fundamentals and applications. Nat Protoc 4: 1350–1362. - PMC - PubMed
    1. Achuthan S, Santhoshkumar TR, Prabhakar J, Nair SA, Pillai MR. 2011. Drug-induced senescence generates chemoresistant stemlike cells with low reactive oxygen species. J Biol Chem 286: 37813–37829. - PMC - PubMed
    1. Acosta JC, O'Loghlen A, Banito A, Guijarro MV, Augert A, Raguz S, Fumagalli M, Da Costa M, Brown C, Popov N, et al. 2008. Chemokine signaling via the CXCR2 receptor reinforces senescence. Cell 133: 1006–1018. - PubMed
    1. Acosta JC, Banito A, Wuestefeld T, Georgilis A, Janich P, Morton JP, Athineos D, Kang TW, Lasitschka F, Andrulis M, et al. 2013. A complex secretory program orchestrated by the inflammasome controls paracrine senescence. Nat Cell Biol 15: 978–990. - PMC - PubMed
    1. Baker DJ, Wijshake T, Tchkonia T, LeBrasseur NK, Childs BG, van de Sluis B, Kirkland JL, van Deursen JM. 2011. Clearance of p16Ink4a-positive senescent cells delays ageing-associated disorders. Nature 479: 232–236. - PMC - PubMed

Publication types

MeSH terms