Review
. 2017 Apr;28(4):1023-1039.
doi: 10.1681/ASN.2016060666. Epub 2017 Jan 31.

Glomerular Hyperfiltration in Diabetes: Mechanisms, Clinical Significance, and Treatment

Affiliations
Review

Glomerular Hyperfiltration in Diabetes: Mechanisms, Clinical Significance, and Treatment

Lennart Tonneijck et al. J Am Soc Nephrol. 2017 Apr.

Abstract

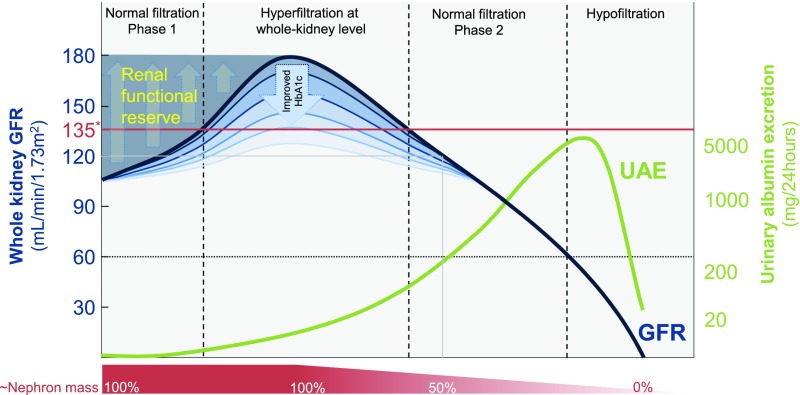
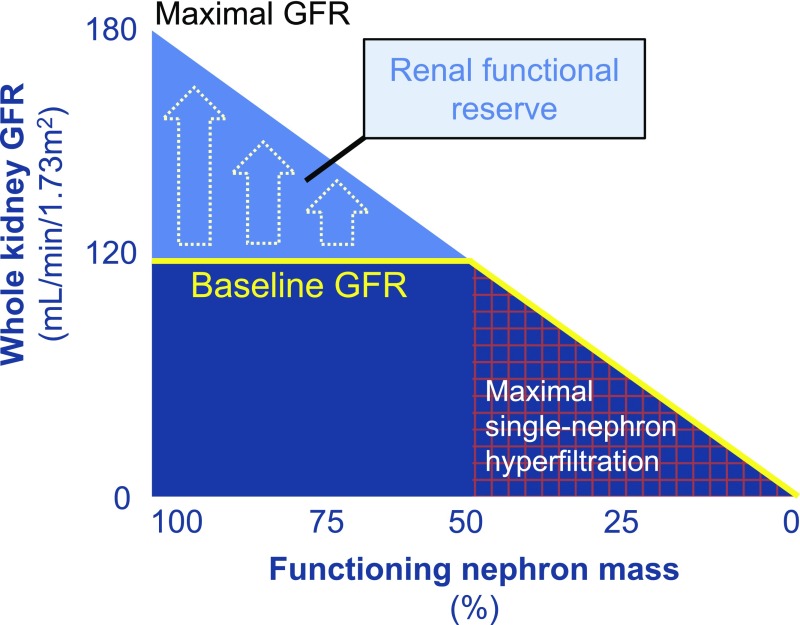
An absolute, supraphysiologic elevation in GFR is observed early in the natural history in 10%-67% and 6%-73% of patients with type 1 and type 2 diabetes, respectively. Moreover, at the single-nephron level, diabetes-related renal hemodynamic alterations-as an adaptation to reduction in functional nephron mass and/or in response to prevailing metabolic and (neuro)hormonal stimuli-increase glomerular hydraulic pressure and transcapillary convective flux of ultrafiltrate and macromolecules. This phenomenon, known as glomerular hyperfiltration, classically has been hypothesized to predispose to irreversible nephron damage, thereby contributing to initiation and progression of kidney disease in diabetes. However, dedicated studies with appropriate diagnostic measures and clinically relevant end points are warranted to confirm this assumption. In this review, we summarize the hitherto proposed mechanisms involved in diabetic hyperfiltration, focusing on ultrastructural, vascular, and tubular factors. Furthermore, we review available evidence on the clinical significance of hyperfiltration in diabetes and discuss currently available and emerging interventions that may attenuate this renal hemodynamic abnormality. The revived interest in glomerular hyperfiltration as a prognostic and pathophysiologic factor in diabetes may lead to improved and timely detection of (progressive) kidney disease, and could provide new therapeutic opportunities in alleviating the renal burden in this population.

Keywords: albuminuria; diabetes; diabetic nephropathy; glomerular filtration rate; glomerular hyperfiltration.


Figures

Figure 1.
Figure 1.
Classic course of whole-kidney GFR and UAE according to the natural (proteinuric) pathway of DKD. Peak GFR may be seen in prediabetes or shortly after diabetes diagnosis, and can reach up to 180 ml/min in the case of two fully intact kidneys. Strict control of HbA1c and initiation of other treatments (such as RAS inhibition) mitigate this initial response. Two normal filtration phases can be encountered, in which GFR may be for instance 120 ml/min (indicated with the gray line): one at 100% of nephron mass and one at approximately 50% of nephron mass. Thus, whole-kidney GFR may remain normal even in the presence of considerable loss of nephron mass, as evidenced by a recent autopsy study. Assessing renal functional reserve and/or UAE may help identify the extent of subclinically inflicted loss of functional nephron mass. *Whole-kidney hyperfiltration is generally defined as a GFR that exceeds approximately 135 ml/min, and is indicated with the red line. Heterogeneity of single-nephron filtration rate and nonproteinuric pathway of DKD are not illustrated.
Figure 2.
Figure 2.
Schematic representation of renal functional reserve. Renal functional reserve is defined as the capacity of the kidney to compensate or increase its function in states of demand (e.g., high protein or fluid intake, pregnancy) or disease (e.g., diabetes, CKD). In early diabetes, when nephron mass is still >50%, renal functional reserve may be reduced due to prevailing metabolic and (neuro)hormonal factors that increase baseline GFR. In later stages, additional renal hemodynamic adaptations occur in response to reduced renal mass, leading to continuous maximal use of glomerular filtration capacity.
Figure 3.
Figure 3.
Schematic (net) effect of factors implicated in the pathogenesis of glomerular hyperfiltration in diabetes. Several vascular and tubular factors,,– are suggested to result in a net reduction in afferent arteriolar resistance, thereby increasing (single-nephron) GFR. Effects of insulin per se seem to depend on insulin sensitivity., A net increase in efferent arteriolar resistance—leading to increased GFR—is proposed for other vascular factors.,,,, Growth hormone and insulin-like growth factor-1 likely increase filtration by augmenting total renal blood flow, without specific arteriolar preference. Glucagon and vasopressin seem to (principally) act through TGF. Intrinsic defects of electromechanical coupling or alterations in signal transduction in afferent arterioles may impair vasoactive responses to renal hemodynamic (auto)regulation. Augmented filtration by increases in the ultrafiltration coefficient, and net filtration pressure via reduction in intratubular volume and subsequent hydraulic pressure in Bowman’s space are not depicted. Several vascular factors may be released or activated after a (high-protein) meal (e.g., nitric oxide, cyclooxygenase-2 prostanoids, angiotensin II),,, whereas TGF becomes (further) inhibited, through increased amino acid- (and glucose) coupled sodium reabsorption in the proximal tubule, and/or increased glucagon/vasopressin-dependent sodium reabsorption in the thick ascending limb. These changes may collectively play a part in postprandial hyperfiltration. COX-2, cyclooxygenase-2; ETA, endothelin A receptor.
Figure 4.
Figure 4.
An acute fall in eGFR in losartan-assigned T2DM patients with DKD is inversely correlated with the long-term eGFR slope, after correction for sex, baseline eGFR, diastolic BP, hemoglobin, and urinary albumin-to-creatinine ratio. Data adapted from Holtkamp and colleagues.
Figure 5.
Figure 5.
Renal function trajectory in the EMPA-REG OUTCOME trial. In this study, 7020 patients with T2DM at high cardiovascular risk were randomly assigned to receive the SGLT2 inhibitor empagliflozin (10 or 25 mg once daily) or placebo. After an initial drop in eGFR documented at week 4, renal function stabilized in empagliflozin-treated patients over the ensuing follow-up period, whereas among those patients receiving placebo, a steady decline of 1.67 ml/min per 1.73 m2 per year in eGFR was observed. After 34 days of cessation of the study drug, the initial decrease in eGFR in all empagliflozin-treated patients was completely reversed with an adjusted mean difference from placebo in the change from baseline eGFR of 4.7 ml/min per 1.73 m2 (not depicted). Adapted from Wanner and colleagues.

References

    1. Tuttle KR, Bakris GL, Bilous RW, Chiang JL, de Boer IH, Goldstein-Fuchs J, Hirsch IB, Kalantar-Zadeh K, Narva AS, Navaneethan SD, Neumiller JJ, Patel UD, Ratner RE, Whaley-Connell AT, Molitch ME: Diabetic kidney disease: A report from an ADA Consensus Conference. Diabetes Care 37: 2864–2883, 2014 - PMC - PubMed
    1. National Kidney Foundation : KDOQI clinical practice guideline for diabetes and CKD: 2012 update. Am J Kidney Dis 60: 850–886, 2012 - PubMed
    1. American Diabetes Association : Cardiovascular disease and risk management, section 8. In standards of medical care in diabetes-2016. Diabetes Care 39(Suppl 1): S60–S71, 2016 - PubMed
    1. United Stated Renal Data System (USRDS). 2016 Annual Data Report, Vol 1, CKD, Chapter 1. Available at: http://www.usrds.org. Accessed January 3, 2017
    1. Pollak MR, Quaggin SE, Hoenig MP, Dworkin LD: The glomerulus: The sphere of influence. Clin J Am Soc Nephrol 9: 1461–1469, 2014 - PMC - PubMed

MeSH terms