. 2017 Mar 6;214(3):639-649.
doi: 10.1084/jem.20161461. Epub 2017 Jan 31.

The Eph-related tyrosine kinase ligand Ephrin-B1 marks germinal center and memory precursor B cells

Affiliations

The Eph-related tyrosine kinase ligand Ephrin-B1 marks germinal center and memory precursor B cells

Brian J Laidlaw et al. J Exp Med. .

Abstract

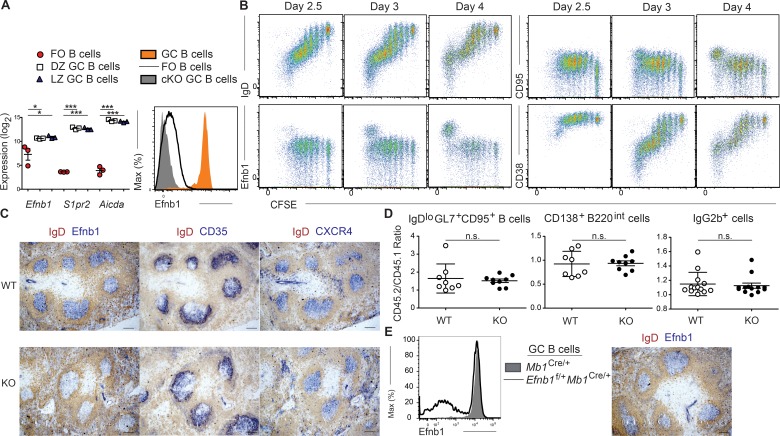
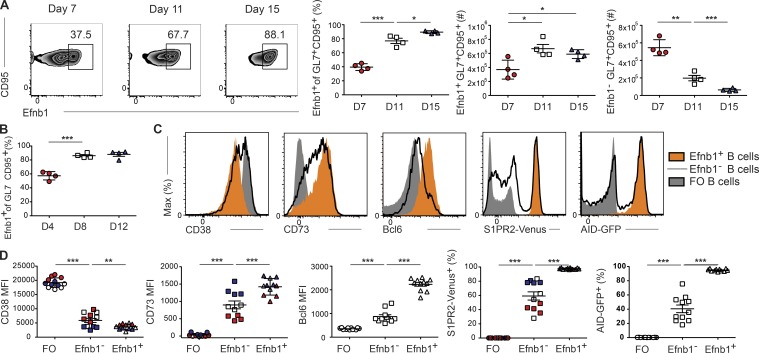
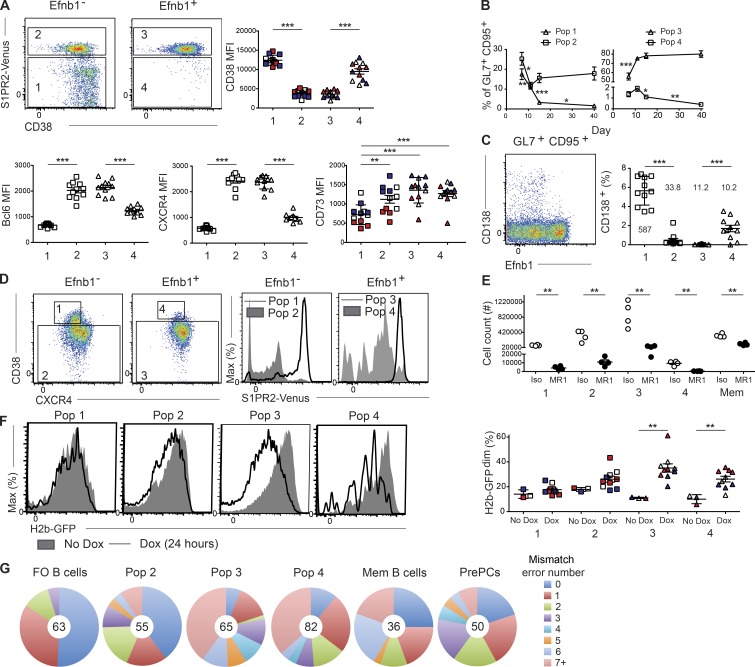
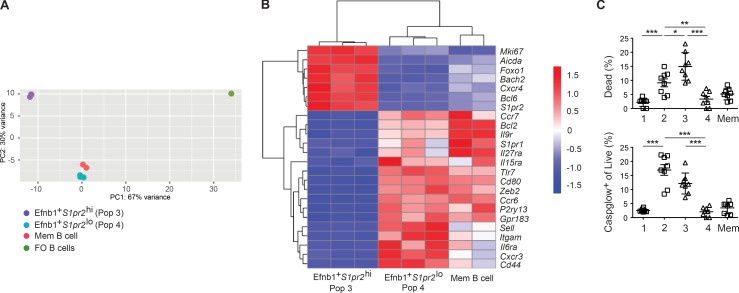
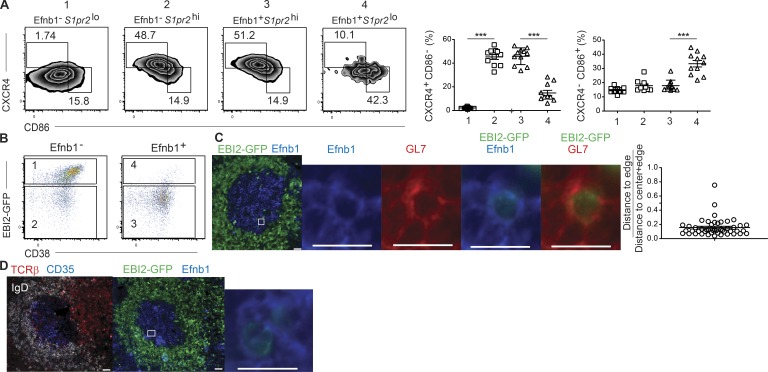
Identification of germinal center (GC) B cells is typically reliant on the use of surface activation markers that exhibit a wide range of expression. Here, we identify Ephrin-B1, a ligand for Eph-related receptor tyrosine kinases, as a specific marker of mature GC B cells. The number of Ephrin-B1+ GC B cells increases during the course of an immune response with Ephrin-B1+ GC B cells displaying elevated levels of Bcl6, S1pr2, and Aicda relative to their Ephrin-B1- counterparts. We further identified a small proportion of recently dividing, somatically mutated Ephrin-B1+ GC B cells that have begun to down-regulate Bcl6 and S1pr2 and express markers associated with memory B cells, such as CD38 and EBI2. Transcriptional analysis indicates that these cells are developmentally related to memory B cells, and likely represent a population of GC memory precursor (PreMem) B cells. GC PreMem cells display enhanced survival relative to bulk GC B cells, localize near the edge of the GC, and are predominantly found within the light zone. These findings offer insight into the significant heterogeneity that exists within the GC B cell population and provide tools to further dissect signals regulating the differentiation of GC B cells.


Figures

Figure 1.
Figure 1.
Ephrin-B1 is highly expressed on GC B cells. (A) Analysis of the expression of Efnb1, S1pr2, and Aicda transcripts in IgD+CD23+GL7CD95 follicular B cells, CXCR4hi (DZ), and CXCR4lo (LZ) GC B cells, gated as IgDloGL7+CD95+ cells at day 8 after SRBC immunization (left). Expression was determined using an Affymetrix Mouse Genome 430 2.0 Array with data combined from three independent experiments in which each population was sorted from multiple pooled mice. Expression of Ephrin-B1 in Mb1Cre/+ follicular and GC B cells and in Efnb1f/fMb1Cre/+ (cKO) GC B cells at day 12 after SRBC immunization (right). Data are representative of three independent experiments with at least three mice per group. (B) Analysis of Ephrin-B1 up-regulation in antigen-specific B cells. CFSE-labeled lysozyme-specific (MD4) transgenic B cells and OT-II T cells were transferred to mice 1 d before immunization with DEL-OVA. Splenocytes were analyzed at days 2.5, 3, and 4 after immunization, and expression of IgD, CD95, Ephrin-B1, and CD38 was determined as compared with CFSE dilution in the transferred MD4 B cell population. Data are representative of at least two independent experiments at each time point. (C) Representative images of GCs in spleens from Efnb1f/fMb1Cre/+ (KO) and Mb1Cre/+ (WT) mice at day 12 after SRBC immunization. Data are representative of many imaged GCs from at least three mice of each type. All GC clusters in WT mice were Efnb1+. Bar, 50 µm. (D) Analysis of the GC response in mice in which CD45.2+ Efnb1f/fMb1Cre/+ or Mb1Cre/+ Hy10 cells were transferred, along with CD45.1+ wild-type Hy10 cells and OT-II T cells, 1 d before immunization with DEL-OVA. GC B cells were defined as IgDloGL7+CD95+ cells. Data are pooled from three independent experiments with two to three mice per group analyzed at day 7 after immunization. No statistical differences were found between groups. (E) Representative histogram of Ephrin-B1 expression in GC B cells from female Efnb1f/+Mb1Cre/+, and Mb1Cre/+ mice at day 12 after SRBC immunization (left). Representative Efnb1 staining in an Efnb1f/+Mb1Cre/+ mouse spleen (right). Data are representative of at least two mice of each type. Bar, 50 µm. Statistical analyses were performed using the unpaired two-tailed Student’s t test (*, P < 0.05; **, P < 0.01; ***, P < 0.001).
Figure 2.
Figure 2.
Ephrin-B1 marks mature GC B cells. (A) Representative FACS plots of Ephrin-B1 expression (left) and percentages and numbers of Efnb1+ and Efnb1 (right) splenic IgDloGL7+CD95+ B cells at days 7, 11, and 15 after LCMV Arm infection. (B) Percentage of Efnb1+ splenic IgDloGL7+CD95+ B cells at days 4, 8, and 12 after SRBC immunization. (C and D) Histograms (C) and plots of mean fluorescence intensity (MFI; D) of CD38, CD73, Bcl6, S1pr2 (as defined using S1pr2Venus/+ mice), and Aicda (as defined using AID-GFP mice) expression in follicular (IgD+GL7) and Efnb1+ and Efnb1 IgDloGL7+CD95+ B cells. Data are from day 7 (red), 11 (white), and 15 (dark blue) after LCMV Arm infection. Data for the CD38, CD73, and S1pr2 plots are from one experiment with three to four mice per time point at days 7, 11, and 15 and are representative of two independent experiments at days 7 and 15, and four experiments at day 11. Data for the Bcl6 and Aicda plots are pooled from three independent experiments with 3–4 mice per group at day 11 after infection. Statistical analyses were performed using the unpaired two-tailed Student’s t test (*, P < 0.05; **, P < 0.01; ***, P < 0.001).
Figure 3.
Figure 3.
Ephrin-B1 and S1pr2 can distinguish transitional populations of GC B cells. (A) Representative plots (left) of S1pr2 (as defined using S1pr2Venus/+ mice) and CD38 expression in splenic Efnb1 and Efnb1+ IgDloGL7+CD95+ B cells. Expression of CD38 (right), Bcl6, CXCR4, and CD73 (bottom) was determined at day 7 (red), 11 (white), or 15 (dark blue) after LCMV Arm infection in Efnb1 S1pr2lo (Pop 1), Efnb1 S1pr2hi (Pop 2), Efnb1+ S1pr2hi (Pop 3), and Efnb1+ S1pr2lo (Pop 4) IgDloGL7+CD95+ B cells. Data for the Bcl6 and CXCR4 plots are pooled from three experiments with three to four mice per group at day 11 after infection. (B) Percentage of IgDloGL7+CD95+ B cells that comprise the populations defined in A at day 7, 11, 15, and 40 after LCMV Arm infection. Data for the CD38 and CD73 plots are from one experiment with three to four mice per time point at days 7, 11, and 15 and are representative of two independent experiments for days 7 and 15, one experiment with four mice at day 40, and four experiments at day 11. (C) Representative plot (left) of CD138 and Ephrin-B1 expression in splenic B220+ IgDloGL7+CD95+ B cells. Percentage of CD138+ cells within each population as defined in A (right). Number indicates the mean number of CD138+ cells in each population per million B cells. Data are pooled from three experiments with three to four mice per group at day 11 after infection. (D) Representative plots (left) of IgDloGL7+CD95+ GC B cells are divided into four subsets (labeled 1–4) with the following marker profile: Efnb1 CD38+CXCR4lo (Pop 1), Efnb1 CD38 (Pop 2), Efnb1+ CD38 (Pop 3), and Efnb1+ CD38+CXCR4lo (Pop 4; left). Representative plots (right) of S1pr2 (as defined using S1pr2Venus/+ mice) in the populations defined using CD38 and CXCR4. (E) Number of Efnb1 CD38+CXCR4lo (Pop 1), Efnb1 CD38 (Pop 2), Efnb1+ CD38 (Pop 3), and Efnb1+ CD38+CXCR4lo (Pop 4) IgDloGL7+CD95+ B cells and memory (IgDloGL7CD95+CD73+) B cells at day 13 after LCMV Arm infection in mice treated with anti-CD40L (MR1) or an isotype control antibody from days 9–12. Data are from one experiment representative of two independent experiments with four mice per group. (F) Representative histograms (left) of H2b-GFP expression in the populations defined in D in untreated or doxycycline treated Tet-off H2b-GFP mice. Analysis (right) of the percentage of H2b-GFPdim at day 7 (red), day 11 (white), or day 15 (dark blue) after LCMV Arm infection. Mice were treated with doxycycline (dox) 24 h before analysis with one mouse per time point not treated to determine background GFP dilution. Data are from one experiment representative of two independent experiments with three to four mice per time point. (G) Analysis of mismatch error rate frequency in 700 bp of the JH558 intronic sequence in follicular (IgD+GL7) B cells, Efnb1 S1pr2hi (Pop 2), Efnb1+ S1pr2hi (Pop 3), Efnb1+ S1pr2lo (Pop 4) IgDloGL7+CD95+ B cells, memory (IgDloGL7CD95+CD73+) B cells, and pre plasma (IgDloGL7+CD95+CD138+) cells sorted at day 11 after LCMV infection. Number of sequences analyzed for each population is listed in the center of each circle. Cells were pooled from two independent experiments with four mice per experiment. Statistical analyses were performed using the unpaired two-tailed Student's t test (*, P < 0.05; **, P < 0.01; ***, P < 0.001).
Figure 4.
Figure 4.
Efnb1+ S1pr2lo cells are transcriptionally and functionally similar to memory B cells. (A) Principal component analysis of RNA-seq data from splenic Efnb1+ S1pr2hi (Pop 3), Efnb1+ S1pr2lo (Pop 4), and memory (IgDloGL7CD95+CD73+) B cells at day 11 after LCMV Arm infection. Published RNA-seq data from splenic follicular (FO) B cells (small, B220+CD21+CD23+ cells) was equivalently analyzed and included as a reference (Shi et al., 2015). (B) Heat map of select DEGs among mRNA isolated from the aforementioned populations, presented as expression (log2) normalized by row. Genes with a Padj < 0.1 and log2fold change > 1.5 between the Efnb1+ S1pr2hi (Pop 3) and Efnb1+ S1pr2lo (Pop 4) groups, and that had a base mean count across all three groups >100, were considered DEGs. Data are from three independent experiments with four mice per experiment pooled for each sample. (C) Splenocytes from day 11 after LCMV Arm–infected mice were cultured for 5 h at 37°C. Percentage of dead cells (top) and caspase expression in live cells (bottom) in Efnb1 CD38+CXCR4lo (Pop 1), Efnb1 CD38 (Pop 2), Efnb1+ CD38 (Pop 3), and Efnb1+ CD38+CXCR4lo (Pop 4) IgDloGL7+CD95+ B cells and memory (IgDloGL7CD95+CD73+) B cells. Data are pooled from two independent experiments with four mice per experiment. Statistical analyses were performed using the unpaired two-tailed Student’s t test (*, P < 0.05; **, P < 0.01; ***, P < 0.001).
Figure 5.
Figure 5.
GC memory precursor cells localize near the edge of the LZ. (A) Representative plots (left) and summary graphs (right) of the percentages of splenic DZ (CXCR4+CD86) and LZ (CXCR4CD86+) phenotype cells in in Efnb1 S1pr2lo (Pop 1), Efnb1 S1pr2hi (Pop 2), Efnb1+ S1pr2hi (Pop 3), and Efnb1+ S1pr2lo (Pop 4) IgDloGL7+CD95+ B cells at day 11 after LCMV infection. Data are pooled from three independent experiments with three to four mice per group at day 11 after infection. Statistical analyses were performed using the unpaired two-tailed Student’s t test (***, P < 0.001). (B) Representative plots of EBI2 (as defined using EBI2GFP/+ mice) and CD38 expression in Efnb1 and Efnb1+ IgDloGL7+CD95+ B cells at day 11 after LCMV infection. Plots are representative of four independent experiments with three to four mice per experiment at days 11 or 15 after infection. (C) Representative images of Ephrin-B1, GL7, and EBI2 (as defined using EBI2GFP/+ mice). Distance of Efnb1+GL7+IgDlo EBI2+ GC B cells from the edge of the GC was determined using Imaris software to determine the GC center, and then determining distance from the center to the cell and from the cell to the GC edge. Distance was quantified in such a manner that the mean distance from the GC center to GC B cells divided by the total distance from the GC center to the edge was ∼0.375. (D) Representative images of GC polarization as determined by the distribution of CD35+ FDCs and positioning of the T cell zone, and Ephrin-B1 and EBI2 (as defined using EBI2GFP/+ mice) in serial sections. Analysis of CD35 staining in serial sections of 21 GCs where Efnb1+ EBI2+ cells were identified indicated that 22 of 25 identified cells were LZ resident. Data are representative of six independent EBI2GFP/+ mice at either day 11 or day 15 after LCMV infection. Bars: (left) 20 µm; (right) 10 µm (inset).

References

    1. Adachi Y., Onodera T., Yamada Y., Daio R., Tsuiji M., Inoue T., Kobayashi K., Kurosaki T., Ato M., and Takahashi Y.. 2015. Distinct germinal center selection at local sites shapes memory B cell response to viral escape. J. Exp. Med. 212:1709–1723. 10.1084/jem.20142284 - DOI - PMC - PubMed
    1. Alfaro D., García-Ceca J.J., Cejalvo T., Jiménez E., Jenkinson E.J., Anderson G., Muñoz J.J., and Zapata A.. 2007. EphrinB1-EphB signaling regulates thymocyte-epithelium interactions involved in functional T cell development. Eur. J. Immunol. 37:2596–2605. 10.1002/eji.200737097 - DOI - PubMed
    1. Allen C.D.C., Okada T., Tang H.L., and Cyster J.G.. 2007. Imaging of germinal center selection events during affinity maturation. Science. 315:528–531. 10.1126/science.1136736 - DOI - PubMed
    1. Anderson S.M., Tomayko M.M., Ahuja A., Haberman A.M., and Shlomchik M.J.. 2007. New markers for murine memory B cells that define mutated and unmutated subsets. J. Exp. Med. 204:2103–2114. 10.1084/jem.20062571 - DOI - PMC - PubMed
    1. Bannard O., Horton R.M., Allen C.D.C., An J., Nagasawa T., and Cyster J.G.. 2013. Germinal center centroblasts transition to a centrocyte phenotype according to a timed program and depend on the dark zone for effective selection. Immunity. 39:912–924. 10.1016/j.immuni.2013.08.038 - DOI - PMC - PubMed