

Development of a Novel Quantum Dots and Graphene Oxide Based FRET Assay for Rapid Detection of invA Gene of Salmonella
- PMID: 28144237
- PMCID: PMC5239778
- DOI: 10.3389/fmicb.2017.00008
Development of a Novel Quantum Dots and Graphene Oxide Based FRET Assay for Rapid Detection of invA Gene of Salmonella
Abstract
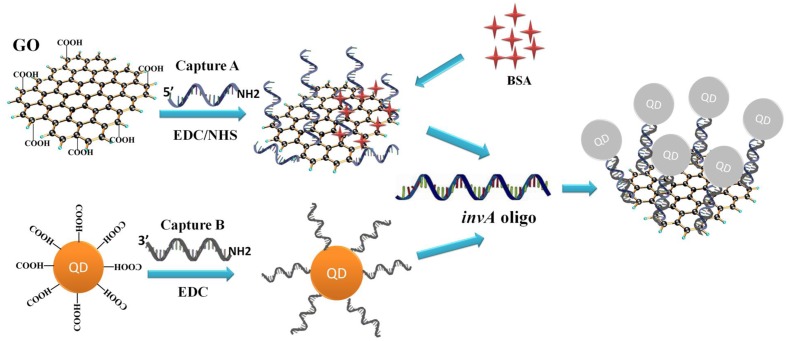
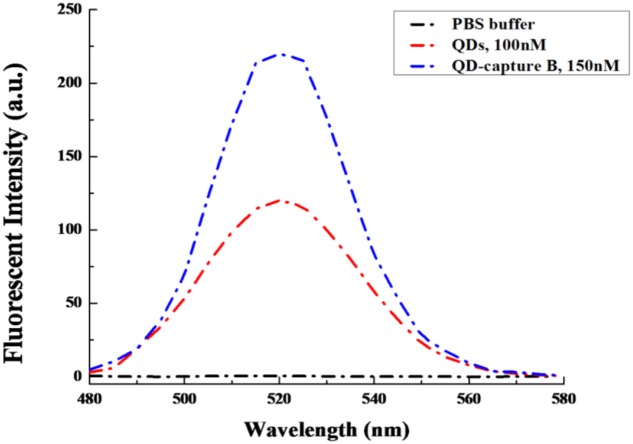
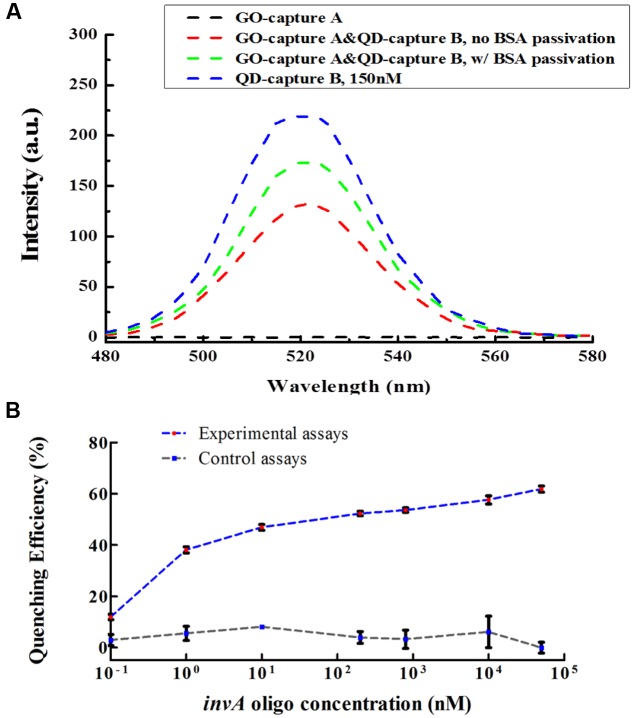
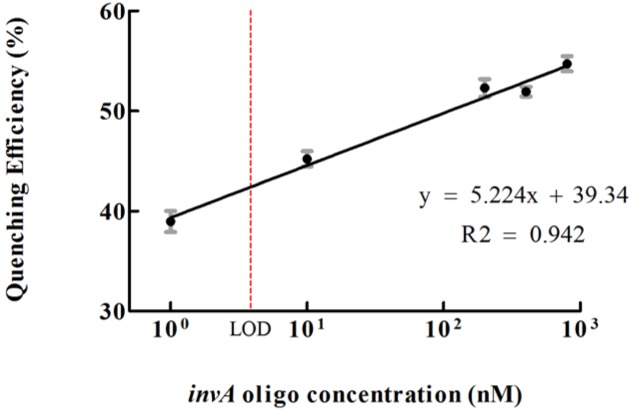
A novel, rapid and simple fluorescence resonance energy transfer (FRET) based Salmonella specific gene, invA, detection system was developed, in which quantum dots (QDs) and graphene oxide (GO) worked as fluorescent donor and quencher, respectively. By measuring the fluorescence intensity signal, the Salmonella specific invA gene could be sensitively and specifically detected with a limit of detection (LOD) of ∼4 nM of the invA gene in 20 min. The developed system has the potential to be used for Salmonella detection in food and environmental samples and further developed into a platform for detection of other bacterial pathogens.
Keywords: FRET assay; Salmonella; graphene oxide; invA; quantum dots; rapid detection.
Figures
Similar articles
-
Highly adaptable and sensitive FRET-based aptamer assay for the detection of Salmonella paratyphi A.Spectrochim Acta A Mol Biomol Spectrosc. 2020 Dec 15;243:118662. doi: 10.1016/j.saa.2020.118662. Epub 2020 Aug 4. Spectrochim Acta A Mol Biomol Spectrosc. 2020. PMID: 32810775
-
Highly-sensitive aptasensor based on fluorescence resonance energy transfer between l-cysteine capped ZnS quantum dots and graphene oxide sheets for the determination of edifenphos fungicide.Biosens Bioelectron. 2017 Oct 15;96:324-331. doi: 10.1016/j.bios.2017.05.028. Epub 2017 May 12. Biosens Bioelectron. 2017. PMID: 28525850
-
Fluorescence resonance energy transfer between quantum dots and graphene oxide for sensing biomolecules.Anal Chem. 2010 Jul 1;82(13):5511-7. doi: 10.1021/ac100852z. Anal Chem. 2010. PMID: 20524633
-
Fluorescence and Sensing Applications of Graphene Oxide and Graphene Quantum Dots: A Review.Chem Asian J. 2017 Sep 19;12(18):2343-2353. doi: 10.1002/asia.201700814. Epub 2017 Aug 30. Chem Asian J. 2017. PMID: 28742956 Free PMC article. Review.
-
Quantum dots-fluorescence resonance energy transfer-based nanosensors and their application.Biosens Bioelectron. 2015 Dec 15;74:562-74. doi: 10.1016/j.bios.2015.06.076. Epub 2015 Jul 3. Biosens Bioelectron. 2015. PMID: 26188679 Review.
Cited by
-
Advancing biomonitoring of eDNA studies with the Anaconda R package: Integrating soil and One Health perspectives in the face of evolving traditional agriculture practices.PLoS One. 2025 Jan 16;20(1):e0311986. doi: 10.1371/journal.pone.0311986. eCollection 2025. PLoS One. 2025. PMID: 39821144 Free PMC article.
-
Graphene and its derivatives as biomedical materials: future prospects and challenges.Interface Focus. 2018 Jun 6;8(3):20170056. doi: 10.1098/rsfs.2017.0056. Epub 2018 Apr 20. Interface Focus. 2018. PMID: 29696088 Free PMC article. Review.
-
Graphene quantum dots decorated with imatinib for leukemia treatment.J Drug Deliv Sci Technol. 2021 Feb;61:102117. doi: 10.1016/j.jddst.2020.102117. Epub 2020 Sep 28. J Drug Deliv Sci Technol. 2021. PMID: 34457042 Free PMC article.
-
Comparative assessment of phenotypic markers in patients with chronic inflammation: Differences on Bifidobacterium concerning liver status.Eur J Clin Invest. 2025 Feb;55(2):e14339. doi: 10.1111/eci.14339. Epub 2024 Oct 28. Eur J Clin Invest. 2025. PMID: 39468772 Free PMC article.
-
Marine actinobacteria metabolites: unlocking new treatments for acne vulgaris.Front Microbiol. 2025 Jan 6;15:1501951. doi: 10.3389/fmicb.2024.1501951. eCollection 2024. Front Microbiol. 2025. PMID: 39834363 Free PMC article.
References
LinkOut - more resources
Full Text Sources
Other Literature Sources