. 2017 Jan 17:7:681.
doi: 10.3389/fimmu.2016.00681. eCollection 2016.

BRILIA: Integrated Tool for High-Throughput Annotation and Lineage Tree Assembly of B-Cell Repertoires

Affiliations

BRILIA: Integrated Tool for High-Throughput Annotation and Lineage Tree Assembly of B-Cell Repertoires

Donald W Lee et al. Front Immunol. .

Abstract

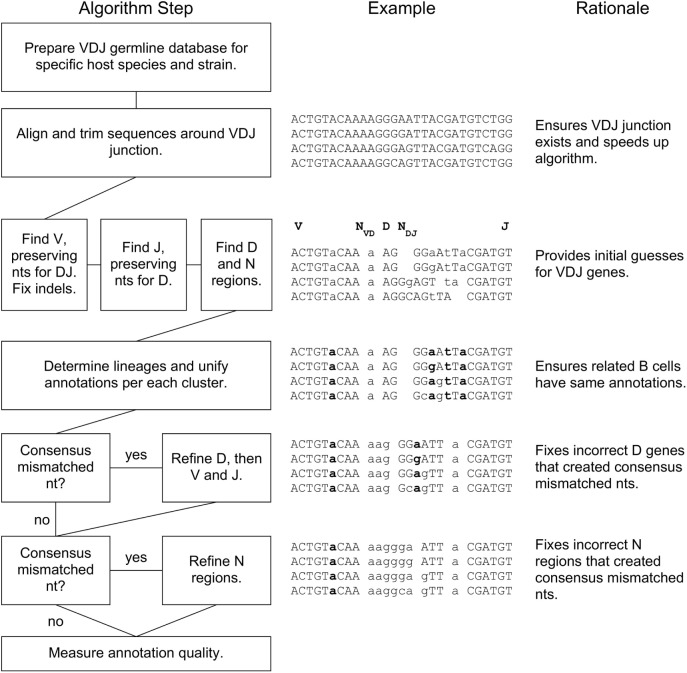
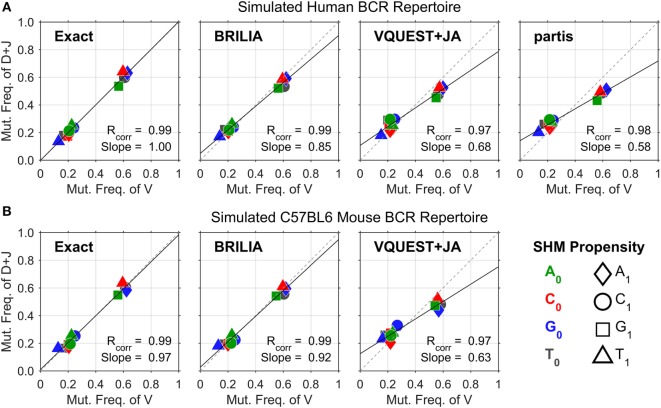
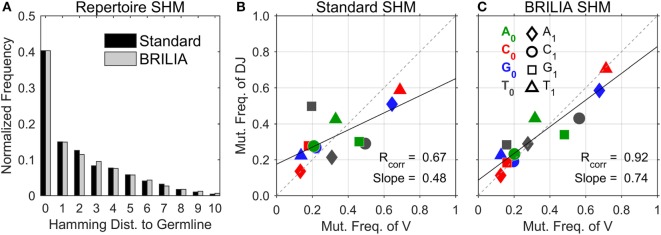
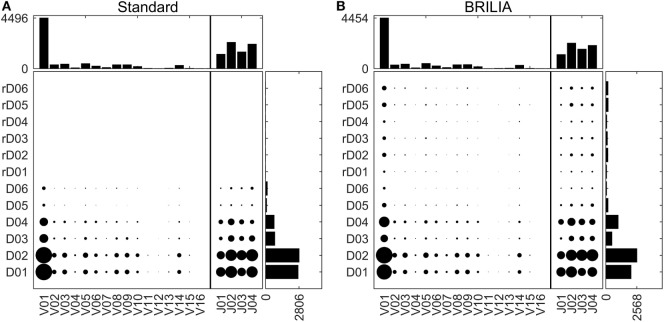
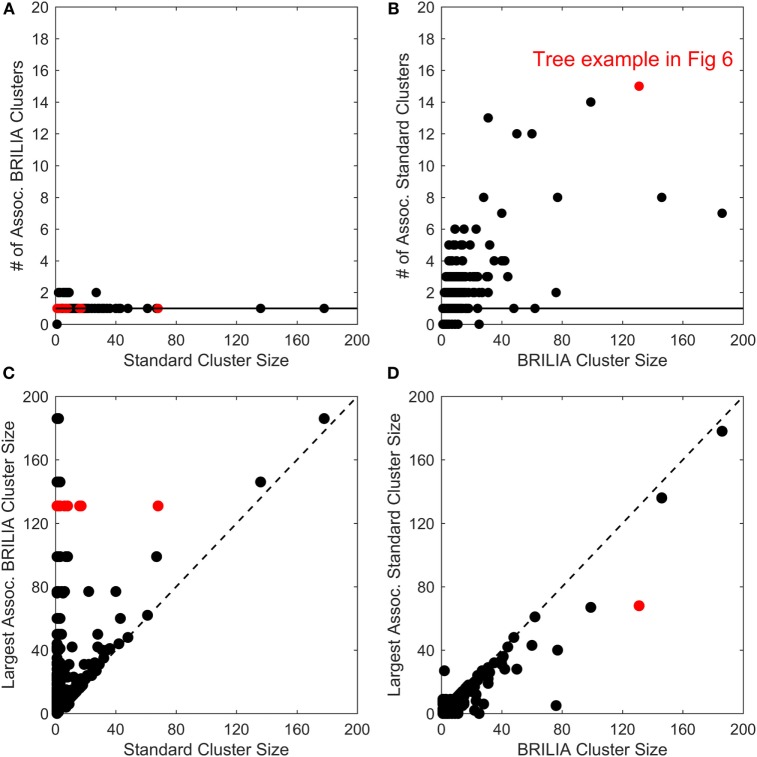
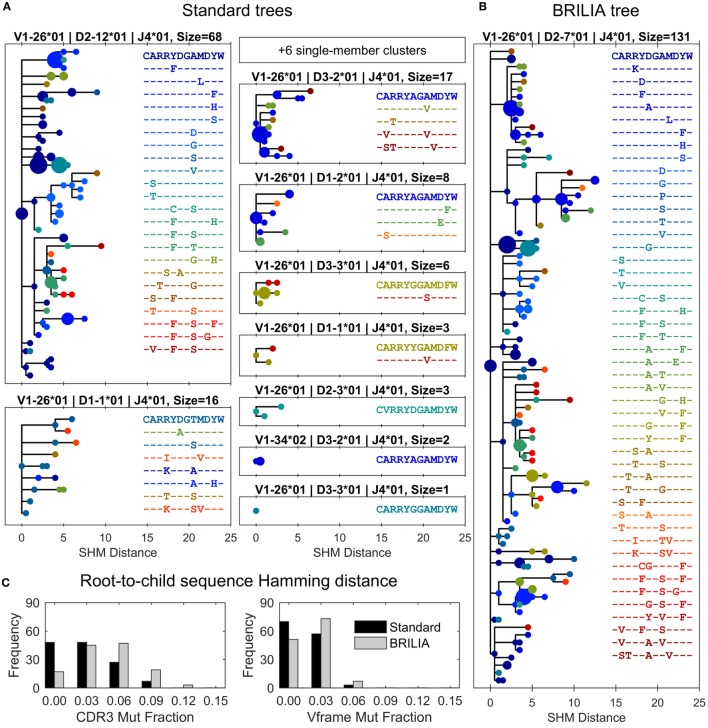
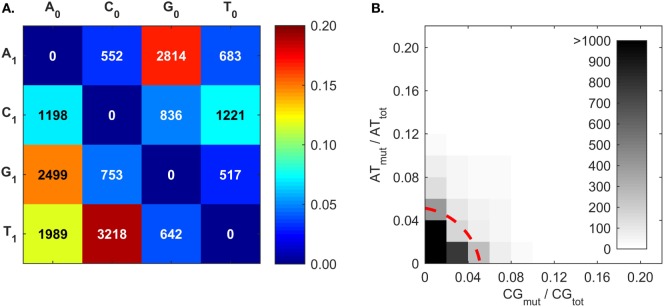
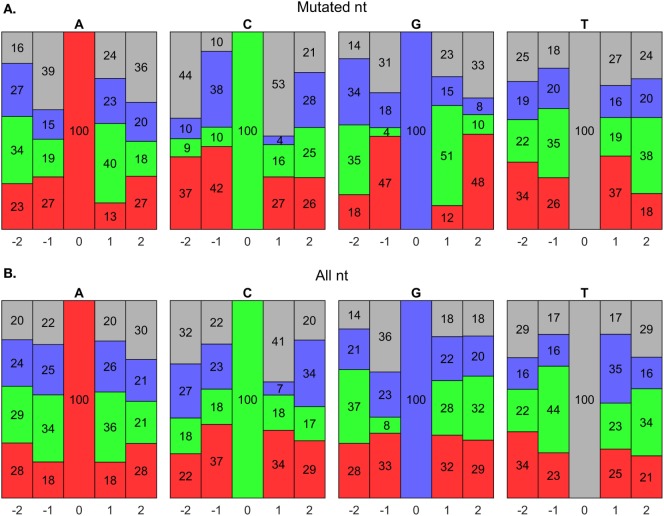
The somatic diversity of antigen-recognizing B-cell receptors (BCRs) arises from Variable (V), Diversity (D), and Joining (J) (VDJ) recombination and somatic hypermutation (SHM) during B-cell development and affinity maturation. The VDJ junction of the BCR heavy chain forms the highly variable complementarity determining region 3 (CDR3), which plays a critical role in antigen specificity and binding affinity. Tracking the selection and mutation of the CDR3 can be useful in characterizing humoral responses to infection and vaccination. Although tens to hundreds of thousands of unique BCR genes within an expressed B-cell repertoire can now be resolved with high-throughput sequencing, tracking SHMs is still challenging because existing annotation methods are often limited by poor annotation coverage, inconsistent SHM identification across the VDJ junction, or lack of B-cell lineage data. Here, we present B-cell repertoire inductive lineage and immunosequence annotator (BRILIA), an algorithm that leverages repertoire-wide sequencing data to globally improve the VDJ annotation coverage, lineage tree assembly, and SHM identification. On benchmark tests against simulated human and mouse BCR repertoires, BRILIA correctly annotated germline and clonally expanded sequences with 94 and 70% accuracy, respectively, and it has a 90% SHM-positive prediction rate in the CDR3 of heavily mutated sequences; these are substantial improvements over existing methods. We used BRILIA to process BCR sequences obtained from splenic germinal center B cells extracted from C57BL/6 mice. BRILIA returned robust B-cell lineage trees and yielded SHM patterns that are consistent across the VDJ junction and agree with known biological mechanisms of SHM. By contrast, existing BCR annotation tools, which do not account for repertoire-wide clonal relationships, systematically underestimated both the size of clonally related B-cell clusters and yielded inconsistent SHM frequencies. We demonstrate BRILIA's utility in B-cell repertoire studies related to VDJ gene usage, mechanisms for adenosine mutations, and SHM hot spot motifs. Furthermore, we show that the complete gene usage annotation and SHM identification across the entire CDR3 are essential for studying the B-cell affinity maturation process through immunosequencing methods.

Keywords: B-cell receptor (BCR); VDJ; annotation; lineage; repertoire; somatic hypermutation (SHM).


Figures

Figure 1
Figure 1
BRILIA flowchart with examples and rationales for each step. For the sample sequences in the middle, the V, NVD, D, NDJ, and J segments are separated by a space, where a double space indicates a lack of N region (e.g., NDJ is absent initially). A lowercase letter is either an N nucleotide (nt) or a mismatched nt with respect to the germline genes, and a bolded letter is a consensus mismatched nt.
Figure 2
Figure 2
Somatic hypermutation (SHM) propensity correlations between the V and DJ segments for simulated (A) human and (B) mouse B-cell receptor sequences. The combination of color and shape of a data point represents a SHM propensity or the mutation frequency of nucleotide (nt) X0 to nt X1. The x- and y axes show the normalized mutation frequencies (e.g., PA➔T + PA➔C + PA➔G = 1) for the V and DJ segments, respectively. Rcorr is the Pearson correlation coefficient, while Slope is the slope of the linear regression line.
Figure 3
Figure 3
Comparison of somatic hypermutation (SHM) identification in real-life C57BL/6 B-cell receptor repertoires between the standard method and BRILIA. (A) Frequency distribution of SHMs per sequence predicted for all sequences in relation to their corresponding cluster’s germline sequence. (B) SHM propensity correlation returned by the standard method. Note that SHMs were determined for parent–child sequence pairs and not germline–child sequence pairs. (C) SHM propensity correlation returned by BRILIA.
Figure 4
Figure 4
V, D, and J gene usage frequencies. Frequency distributions of individual VDJ gene families, and VD and DJ pairs as determined by (A) the standard method and (B) BRILIA.
Figure 5
Figure 5
Comparison of cluster counts and sizes between annotations made using the standard method and BRILIA. (A) Number of BRILIA clusters that are associated (Assoc.) with each standard cluster, where associated clusters share at least one B-cell receptor sequence. The red dots represent clusters whose corresponding lineage trees are shown in Figure 6. (B) Number of standard clusters that are associated with each BRILIA cluster. (C) Largest BRILIA cluster size associated with each standard cluster. The dotted diagonal line (y = x) highlights differences in the associated cluster sizes between the two methods. (D) Largest standard cluster size associated with each BRILIA cluster.
Figure 6
Figure 6
Differences in lineage trees and somatic hypermutation (SHM) frequencies between the associated standard and BRILIA clusters from the example in Figure 5. (A) Lineage trees are assembled from standard clusters that are subsets of a larger associated BRILIA cluster. The x-axis shows the absolute SHM distance, where the difference in SHM values between parent and child sequence is the SHM distance between the two sequences. Each dot color corresponds to a unique CDR3 sequence, and the dot size is scaled proportional to the sequence template count relative to the total template count within each lineage tree. The SHM distance is calculated based on the comparison of two 125-nucleotide sequences. Note that six single-member clusters are not drawn. (B) Lineage tree of a large BRILIA cluster that encompasses standard clusters. (C) Mutation frequencies of the V gene framework and CDR3 predicted by the two methods.
Figure 7
Figure 7
Somatic hypermutation (SHM) frequencies returned by BRILIA, for the purpose of evaluating SHM mechanistic models. (A) Cumulative frequency of SHM propensities for VDJ segments, excluding N regions. X0 is the parent nt and X1 is the child nucleotide. (B) The [A ➔ G + T ➔ C] mutation frequency (ATmut) normalized by the total A + T content (ATtot), plotted against the [C ➔ T + G ➔ A] mutation frequency (CGmut) normalized by the total C + G content in the VDJ segments (CGtot). The dotted red line, which depicts a circle with its center at the origin and a radius of 0.06, marks the mutation rate that captures 90% of the mutated sequences.
Figure 8
Figure 8
Somatic hypermutation (SHM) hot spot analysis using BRILIA annotations. (A) Evaluation of nucleotide (nt) compositions near only mutated nts, which are at the 0 positions. The negative and positive positions are nts toward the 5′ and 3′ sides, respectively, of the 0 position nt. The nt color codes are A = red, C = green, G = blue, and T = gray. (B) Evaluation of nt compositions of all nts, regardless of whether they mutated.
Figure 9
Figure 9
Somatic hypermutations (SHM) in CDR3 and V framework regions. Comparison of the mutations accumulated in the CDR3 versus V framework (Vframe) regions, as determined by (A) the standard method and (B) BRILIA.

Similar articles

Cited by

References

    1. Victora GD, Nussenzweig MC. Germinal centers. Annu Rev Immunol (2012) 30:429–57.10.1146/annurev-immunol-020711-075032 - DOI - PubMed
    1. Jiang N, He J, Weinstein JA, Penland L, Sasaki S, He XS, et al. Lineage structure of the human antibody repertoire in response to influenza vaccination. Sci Transl Med (2013) 5(171):ra19–171.10.1126/scitranslmed.3004794 - DOI - PMC - PubMed
    1. Legutki JB, Johnston SA. Immunosignatures can predict vaccine efficacy. Proc Natl Acad Sci U S A (2013) 110(46):18614–9.10.1073/pnas.1309390110 - DOI - PMC - PubMed
    1. Galson JD, Clutterbuck EA, Trück J, Ramasamy MN, Münz M, Fowler A, et al. BCR repertoire sequencing: different patterns of B-cell activation after two meningococcal vaccines. Immunol Cell Biol (2015) 93(10):885–95.10.1038/icb.2015.57 - DOI - PMC - PubMed
    1. Galson JD, Trück J, Fowler A, Clutterbuck EA, Münz M, Cerundolo V, et al. Analysis of B cell repertoire dynamics following hepatitis b vaccination in humans, and enrichment of vaccine-specific antibody sequences. EBioMedicine (2015) 2(12):2070–9.10.1016/j.ebiom.2015.11.034 - DOI - PMC - PubMed

LinkOut - more resources