. 2017 Jan 25;4(1):ENEURO.0211-16.2016.
doi: 10.1523/ENEURO.0211-16.2016. eCollection 2017 Jan-Feb.

Eye Movements in Darkness Modulate Self-Motion Perception

Affiliations

Eye Movements in Darkness Modulate Self-Motion Perception

Ivar Adrianus H Clemens et al. eNeuro. .

Abstract

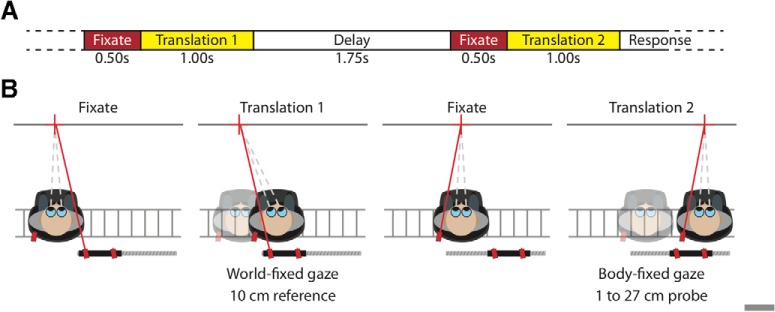
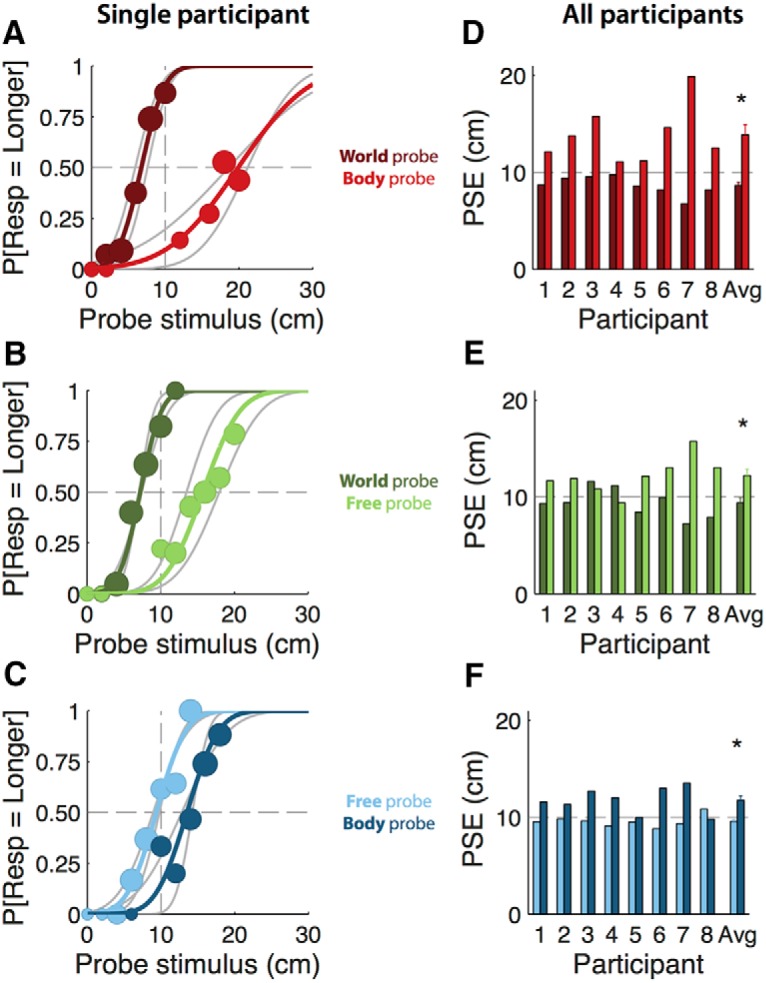
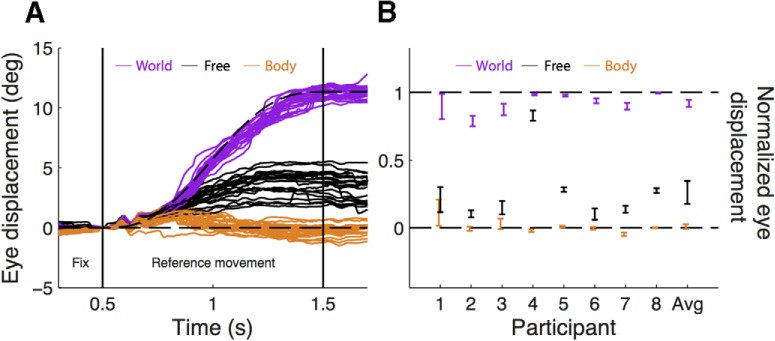
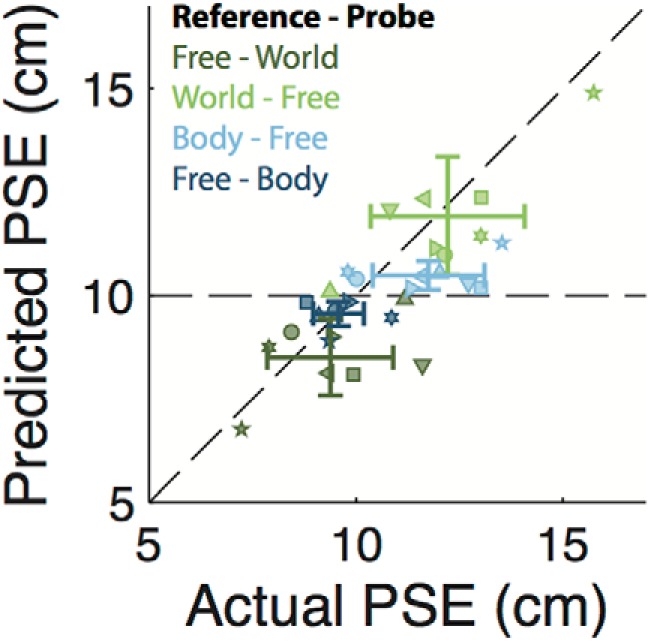
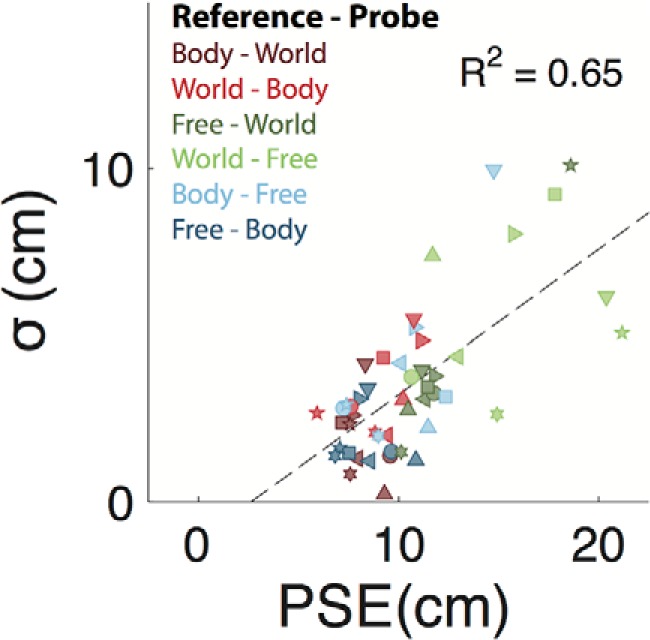
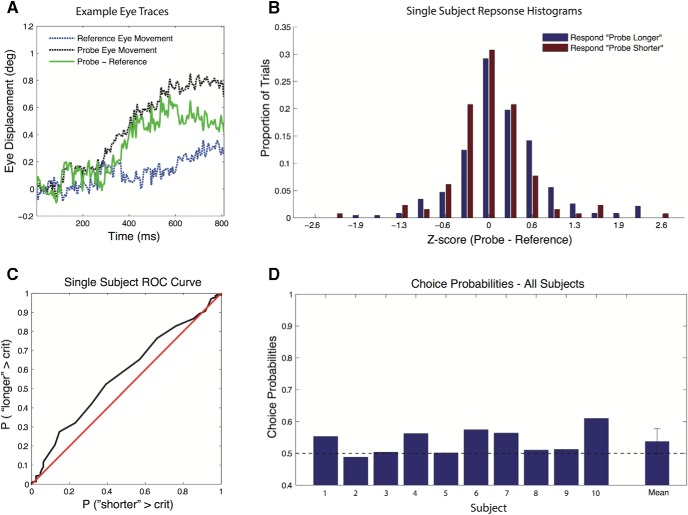
During self-motion, humans typically move the eyes to maintain fixation on the stationary environment around them. These eye movements could in principle be used to estimate self-motion, but their impact on perception is unknown. We had participants judge self-motion during different eye-movement conditions in the absence of full-field optic flow. In a two-alternative forced choice task, participants indicated whether the second of two successive passive lateral whole-body translations was longer or shorter than the first. This task was used in two experiments. In the first (n = 8), eye movements were constrained differently in the two translation intervals by presenting either a world-fixed or body-fixed fixation point or no fixation point at all (allowing free gaze). Results show that perceived translations were shorter with a body-fixed than a world-fixed fixation point. A linear model indicated that eye-movement signals received a weight of ∼25% for the self-motion percept. This model was independently validated in the trials without a fixation point (free gaze). In the second experiment (n = 10), gaze was free during both translation intervals. Results show that the translation with the larger eye-movement excursion was judged more often to be larger than chance, based on an oculomotor choice probability analysis. We conclude that eye-movement signals influence self-motion perception, even in the absence of visual stimulation.

Keywords: integration; oculomotor; perception; self-motion; vestibular.


Figures

Figure 1.
Figure 1.
A, Time course of key events within a single trial. In each of the two intervals, a 0.50 s fixation period (red) precedes the lateral translation (yellow). A 1.75-s-long delay period (shown in white) separates the two intervals. After the second translation, the participant responded whether this second translation was longer or shorter than the first. B, Top view of the setup illustrating key events during a rightward body-world trial where the world-fixed reference interval was presented first. The condition tested is marked using an asterisk in Table 1. The sled-fixed as well as the world-fixed lasers (red) used to present the fixation targets on a black bar (dark gray bar) that runs in parallel with the sled track (light gray bars). First panel, Participant fixates the world-fixed target (red cross) at the start of the first interval. Second panel, Translation with world-fixed fixation target. Third panel, Body-fixed fixation at the start of the second fixation interval. Fourth panel, Translation with body-fixed fixation in second interval.
Figure 2.
Figure 2.
A–C, Psychometric curves (colored lines) and associated binned data (circles) for participant number 7 (top row). Circle size represents the number of trials within each 2 cm bin. Binning was only performed in order to visualize this participant’s responses and was not used otherwise. Gray lines show psychometric curves before collapsing across reference order. Dashed gray lines represent the 10 cm reference movement. A, Body–world comparison; body reference, dark red; world reference, light red. B, World–free comparison; world reference, light green; free reference, dark green. C, Body–free comparison; body reference, dark blue; free reference, light blue. D–F, PSEs for all participants and the average ±SE (bottom row). Dashed gray lines represent the 10cm reference movement. Colors are as in A–C. D, Body–world comparison. E, World–free comparison. F, Body–free comparison. Because a t test revealed a main effect of reference order (t(47) = −5.2, p < 0.01), we used the mean PSE across reference order (e.g., colored lines) instead of the PSE without collapsing across reference order (e.g., gray lines); these values were not significantly different.
Figure 3.
Figure 3.
A, Actual (solid lines) eye-movement traces of one participant during world fixation (purple), body fixation (brown), and free fixation (black). For the body and world fixation, the ideal traces are indicated by the dashed lines. All traces shown are for 10 cm reference movements. B, Normalized eye position for each participant (±95% confidence interval) at the end of the translation interval (error bars) for world fixation (purple), body fixation (brown), and free fixation (blue). In addition, the average ±SE across all participants is shown. Zero indicates that the eyes remained stationary relative to the body, and 1 indicates that eye position was perfectly world fixed.
Figure 4.
Figure 4.
Eye movement-based prediction for the PSE plotted against the actual PSE. A data point (symbol) is shown for each participant (symbol shape) and condition (symbol color) pair, following the same color scheme as in Figure 2. The identity line, corresponding to a perfect prediction, is shown in black.
Figure 5.
Figure 5.
Relationship between PSE and response uncertainty (σ). A data point is shown for every participant (symbol) and condition (color) pair. Same color scheme as in Figure 2. The dashed black line is the linear regression trend line (R2 = 0.65).
Figure 6.
Figure 6.
Choice probabilities derived from trial-by-trial normalized eye-displacement differences. A, Exemplar eye traces from two consecutive body translations of the same magnitude. B, All trials were collapsed after z-scoring the eye-displacement differences per condition. Trials were split based on the subject perceiving the second translation as being longer or shorter. C, ROC curve based on the data in B. D, Choice probabilities for the individual subjects derived from their ROC curves, showing a significant eye-displacement effect on choice probability across subjects (p = 0.018).

References

    1. Angelaki DE, Hess BJM (2005) Self-motion-induced eye movements: effects on visual acuity and navigation. Nat Rev Neurosci 6:966–976. 10.1038/nrn1804 - DOI - PubMed
    1. Benson A, Kass J, Vogel H (1986) European vestibular experiments on the Spacelab-1 mission: 4. Thresholds of perception of whole-body linear oscillation. Exp Brain Res 64:264–271. - PubMed
    1. Bremmer F, Klam F, Duhamel J-R, Ben Hamed S, Graf W (2002) Visual-vestibular interactive responses in the macaque ventral intraparietal area (VIP). Eur J Neurosci 16:1569–1586. - PubMed
    1. Britten KH, Newsome WT, Shadlen MN, Celebrini S, Moversushon JA (1996) A relationship between behavioral choice and the visual responses of neurons in macaque MT. Vis Neurosci 13:87–100. - PubMed
    1. Carriot J, Bryan A, DiZio P, Lackner JR (2011) The oculogyral illusion: retinal and oculomotor factors. Exp Brain Res 209:415–423. 10.1007/s00221-011-2567-5 - DOI - PubMed

Publication types

LinkOut - more resources