. 2017 Nov;10(6):1387-1399.
doi: 10.1038/mi.2016.142. Epub 2017 Feb 1.

Tissue-specific differentiation of colonic macrophages requires TGFβ receptor-mediated signaling

Affiliations

Tissue-specific differentiation of colonic macrophages requires TGFβ receptor-mediated signaling

A Schridde et al. Mucosal Immunol. 2017 Nov.

Abstract

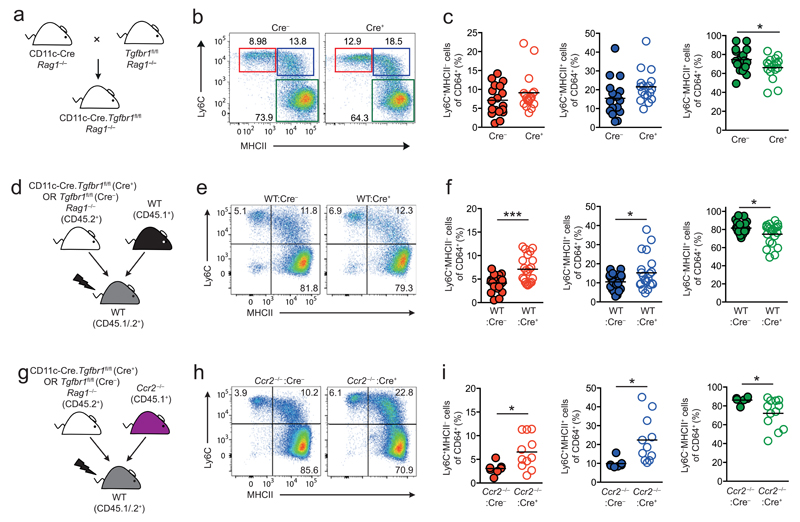
Intestinal macrophages (mφ) form one of the largest populations of mφ in the body and are vital for the maintenance of gut homeostasis. They have several unique properties and are derived from local differentiation of classical Ly6Chi monocytes, but the factors driving this tissue-specific process are not understood. Here we have used global transcriptomic analysis to identify a unique homeostatic signature of mature colonic mφ that is acquired as they differentiate in the mucosa. By comparing the analogous monocyte differentiation process found in the dermis, we identify TGFβ as an indispensable part of monocyte differentiation in the intestine and show that it enables mφ to adapt precisely to the requirements of their environment. Importantly, TGFβR signaling on mφ has a crucial role in regulating the accumulation of monocytes in the mucosa, via mechanisms that are distinct from those used by IL10.


Figures

Figure 1
Figure 1. Transcriptomic Analysis of the Monocyte-Macrophage Differentiation Series in Normal Colonic Mucosa
(a) Hierarchical cluster analysis of mature colonic macrophages (CD11b+CD64+Ly6C MHCII+CX3CR1hi) compared with macrophages from the lung, brain, bone marrow, spleen, peritoneal cavity and dermis (ANOVA; PRaw ≤0.05; PAdj ≤0.037). (b) Expression of Ly6C and MHCII by CD45+CD11b+CD64+ cells (upper panel) and expression of CX3CR1-GFP by the Ly6C MHCII+ cells (lower panel) obtained from the colon of unmanipulated Cx3cr1+/GFP reporter mice. Data are representative of at least 20 independent experiments. (c) Global gene expression profile of Ly6C+MHCII (P1), Ly6C+MHCII+ (P2), Ly6CMHCII+CX3CR1int (P3) and Ly6C+MHCIICX3CR1hi (P4) cells obtained from the colon of unmanipulated Cx3cr1+/GFP reporter mice (ANOVA; PRaw ≤0.05; PAdj ≤0.08). (d) Functionally-defined subsets of mRNA transcripts that are significantly downregulated during differentiation from the P1 to P4 stage in the colon of unmanipulated Cx3cr1+/GFP reporter mice. (Student’s t test; P ≤ 0.05; fold change ≥ 2.0). (e) Flow cytometric analysis of CCR2 and integrin β7 expression by P1-P4 subsets obtained from the colon and small intestine of unmanipulated Cx3cr1+/GFP reporter mice compared with the appropriate isotype control. Data are representative of 3-4 independent experiments. (f) Functionally-defined subsets of mRNA transcripts that are significantly upregulated during differentiation from the P1 to P4 stage in the colon of unmanipulated Cx3cr1+/GFP reporter mice. (Student’s t test; P ≤ 0.05; fold change ≥ 2.0). (g) Subset-specific expression of genes that are progressively upregulated from the P1 to P4 stages and expressed at least twofold higher by mature colonic macrophages compared with any of the tissue resident macrophage populations as in a above. (Student’s t test P≤0.05, fold change ≥ 2.0). (h) Flow cytometric analysis of the expression of cell surface markers identified in f above by P1-P4 subsets obtained from the colon and small intestine of unmanipulated Cx3cr1+/GFP reporter mice compared with appropriate isotype controls. Data are representative of 3-4 independent experiments.
Figure 2
Figure 2. Comparative Transcriptomic Analysis of Monocyte-Macrophage Differentiation in the Colonic Mucosa and Dermis
(a) Hierarchical cluster analysis of mature colonic macrophages (CD11b+CD64+Ly6C MHCII+CX3CR1hi; P4) and macrophages from the lung, brain, bone marrow, spleen, peritoneal cavity and dermis based on the 1004 genes that show a greater than twofold increase in expression between P1 and P4 in the colon (Supplemental Table 1). (b) Principal Component Analysis (PCA) of gene expression by Ly6Chi blood monocytes, P1-P4 subsets from steady state colon and P1-P5 subsets from steady state dermis identified as in Supplementary Figure 2. Numbers in parentheses indicate the relative scaling of the principal variables (ANOVA; PRaw ≤0.05; PAdj ≤0.14). (c) Overlapping and differentially expressed genes that are significantly upregulated (upper panel) and downregulated (lower panel) between P1 and P4 in the colon and P1 and P5 in the dermis. (Student’s t test; P ≤ 0.05; fold change ≥ 2.0; comparing colonic P1 vs P4 and dermal P1 vs P5 respectively). (d) TGFβR pathway-associated genes regulated during colonic macrophage differentiation identified by Gene Set Enrichment Analysis expressed by P1-P4 subsets in colon (C) and P1-P5 subsets in the dermis (D). (KEGG Database; PRaw =0.0031; PAdj ≤0.0107).
Figure 3
Figure 3. TGFβR1 Signalling Regulates Monocyte Accumulation in the Colon
(a) Schematic representation of the CD11c-Cre. Tgfbr1fl/fl strain. (b) Representative expression of Ly6C and MHCII by live CD45+CD11b+CD64+ cells from the colon of CD11c-Cre.Tgfbr1fl/fl (Cre+) or Tgfbr1fl/fl (Cre) littermate controls. (c) Frequency of Ly6C+MHCII (P1), Ly6C+MHCII+ (P2), Ly6CMHCII+ (P3+P4) among CD64+ cells from the colon of CD11c-Cre.Tgfbr1fl/fl (Cre+) or Tgfbr1fl/fl (Cre) littermate controls. Symbols represent individual animals and horizontal bar is the mean of n=17 (Cre+) or 18 (Cre) mice pooled from 5 independent experiments. *P<0.05 as determined by Student’s t-test. (d) Schematic representation of the generation of mixed WT:Cre and WT:Cre+ BM chimeric mice. (e) Representative expression of Ly6C and MHCII by live CD45+CD11b+CD64+ cells from the colon of WT:Cre and WT:Cre+ mixed BM chimeras. (f) Frequency of Ly6C+ MHCII (P1), Ly6C+ MHCII+ (P2), Ly6C MHCII+ (P3+P4) cells among CD64+ cells from the colon of WT:Cre and WT:Cre+ BM chimeric mice. Symbols represent individual animals and horizontal lines are the means of 21 mice per group and are pooled from 5 independent experiments. *P<0.05, **P<0.01, ***P<0.001 as determined by Student’s t-test. (g) Schematic representation of the generation of mixed Ccr2–/–:Cre and Ccr2–/–:Cre+ BM chimeric mice. (h) Representative expression of Ly6C and MHCII by live CD45+CD11b+CD64+ cells from the colon of Ccr2–/–:Cre and Ccr2–/–:Cre+mixed BM chimeras. (i) Frequency of Ly6C+MHCII (P1), Ly6C+MHCII+ (P2), Ly6CMHCII+ (P3+P4) cells among CD64+ cells from the colon of Ccr2–/–:Cre and Ccr2–/–:Cre+ mixed BM chimeras. Data are from 7 (Ccr2–/–:Cre) or 11 (Ccr2–/–:Cre+) mice per group and are pooled from 3-4 independent experiments. *P<0.05 as determined by Student’s t-test.
Figure 4
Figure 4. TGFβR1 Dependent Signalling Shapes Colonic Macrophage Differentiation
(a) Volcano plot comparing the expression of genes that show a greater than twofold change in expression between P1 and P4 in the colon (Supplementary Table 1) by CD11b+CD64+Ly6CMHCII+ (P3+P4) macrophages from CD11c-Cre.Tgfbr1fl/fl (Cre+) or Tgfbr1fl/fl (Cre) littermate controls. Selected genes with fold change ≥ 1.5 and PRaw ≤ 0.05 are highlighted, while genes with fold-change of <1.5 are shown in grey (see also Supplemental Table 2). The dashed line represents the border for PRaw ≤ 0.05. (b) Expression of Ccl8 by Ly6CMHCII+ (P3+P4) cells from the colon of CD11c-Cre.Tgfbr1fl/fl (Cre+) or Tgfbr1fl/fl (Cre) littermate controls. Data are the mean normalised probe intensity + 1 sd taken from the microarray analysis shown in a with 3 biological replicates per group. *P<0.05 as determined by Student’s t-test. (c) Frequency of CD169+ cells amongst Tgfbr1fl/fl-derived (CD45.2+) Ly6CMHCII+ (P3+P4) cells from the colon of WT:Cre and WT:Cre+ mixed BM chimeras. (d) Frequency of Tgfbr1fl/fl-derived CD169+ Ly6C MHCII+ (P3+P4) cells presented as a ratio of their WT-derived counterparts from the same colon of WT:Cre and WT:Cre+ mixed BM chimeras. Bars represent the means of 6 mice per group + s.d. and are pooled from 2 independent experiments. **P<0.01, ****P<0.0001 as determined by Student’s t-test. (e) Quantitative RT-PCR analysis of Tgfbr1, Cx3cr1 and Il10 mRNA in CD11b+CD64+Ly6C MHCII+ (P3+P4) colonic macrophages from the colon of CD11c-Cre.Tgfbr1fl/fl (Cre+) or Tgfbr1fl/fl (Cre) littermate controls. Data are from one experiment with three biological replicates. *P<0.05, **P<0.01 as determined by Student’s t-test. (f) Flow cytometric validation of αvβ5, αv and CD9 expression by P1, P2 and P3+P4 cells from the colon and small intestine of CD11c-Cre.Tgfbr1fl/fl (Cre+) or Tgfbr1fl/fl (Cre) littermate controls (upper panels). MFI are shown for individual animals and horizontal lines represent the mean (lower panels). Data are from one experiment (CD9 for colon and small intestine, αvβ5, αv for small intestine) or pooled from two independent experiments (αvβ5, αv for colon) with 2-7 mice per group. **P<0.01 determined by Mann Whitney test. (g) Expression of TGFβR-dependent genes in a above by the P1-P4 subsets from the colon (C) or P1-P5 subsets from the dermis (D). The genes listed are those expressed at least twofold higher in colon P4 compared with dermal P5 cells. (h) Clustering analysis of tissue macrophage populations based on the TGFβR-dependent module as in a above. The genes listed are those from the highlighted cluster that show overlapping expression between microglia and colonic macrophages. Genes highlighted in red represent genes that have been reported previously as ‘microglia specific’ ,.
Figure 5
Figure 5. TGFβ and IL10 Imprint Non-overlapping Features of Colonic Macrophages
(a) Quantitative RT-PCR analysis of Tgfbr1, Cx3cr1 and Il10 mRNA expression by Tgfbr1fl/fl-derived (CD45.2+) CD11b+CD64+Ly6CMHCII+ (P3+P4) colonic macrophages from the colon of WT:Cre or WT:Cre+ mixed BM chimeric mice. Data are from one experiment with five biological replicates. **P<0.01, ***P<0.001,****P<0.0001 as determined by Student’s t-test. (b) Expression of IL10 (left panel) or TNFα (right panel) by Tgfbr1fl/fl-derived (CD45.2+) P3/4 colonic macrophages from the colon of WT:Cre or WT:Cre+ mixed BM chimeric mice assessed by intracellular cytokine staining following 4.5 hr culture in the presence (+ LPS) or absence (–) of LPS. Symbols represent individual animals and the horizontal lines are the means of 6 mice per group and are pooled from 2 independent experiments. *P<0.05, **P<0.01, ****P<0.0001 as determined by Student’s t-test. (c) Total mRNA transcripts (upper panel) and mRNA transcripts that show a greater than twofold change in expression between P1 and P4 in the colon (lower panel; see also Supplemental Table 1) that show at least twofold difference between Il10ra+/+ and Il10ra–/– colonic macrophages (IL10R-dependent -28) or between Tgfbr1+/+ and Tgfbr1–/– colonic macrophages (TGFβR1-dependent) (Student’s t test; P ≤ 0.05; fold change ≥ 2.0). Genes named in the overlapping regions are impacted by both IL10R and TGFβR1 deficiency.

Similar articles

Cited by

References

    1. Perdiguero EG, Geissmann F. The development and maintenance of resident macrophages. Nature immunology. 2015;17:2–8. - PMC - PubMed
    1. Okabe Y, Medzhitov R. Tissue biology perspective on macrophages. Nature immunology. 2016;17:9–17. - PubMed
    1. Ginhoux F, Guilliams M. Tissue-Resident Macrophage Ontogeny and Homeostasis. Immunity. 2016;44:439–449. - PubMed
    1. Gomez Perdiguero E, et al. Tissue-resident macrophages originate from yolk-sac-derived erythro-myeloid progenitors. Nature. 2015;518:547–551. - PMC - PubMed
    1. Hoeffel G, et al. C-Myb(+) erythro-myeloid progenitor-derived fetal monocytes give rise to adult tissue-resident macrophages. Immunity. 2015;42:665–678. - PMC - PubMed

Publication types

MeSH terms

Substances