

Honeybee locomotion is impaired by Am-CaV3 low voltage-activated Ca2+ channel antagonist
- PMID: 28145504
- PMCID: PMC5286435
- DOI: 10.1038/srep41782
Honeybee locomotion is impaired by Am-CaV3 low voltage-activated Ca2+ channel antagonist
Abstract
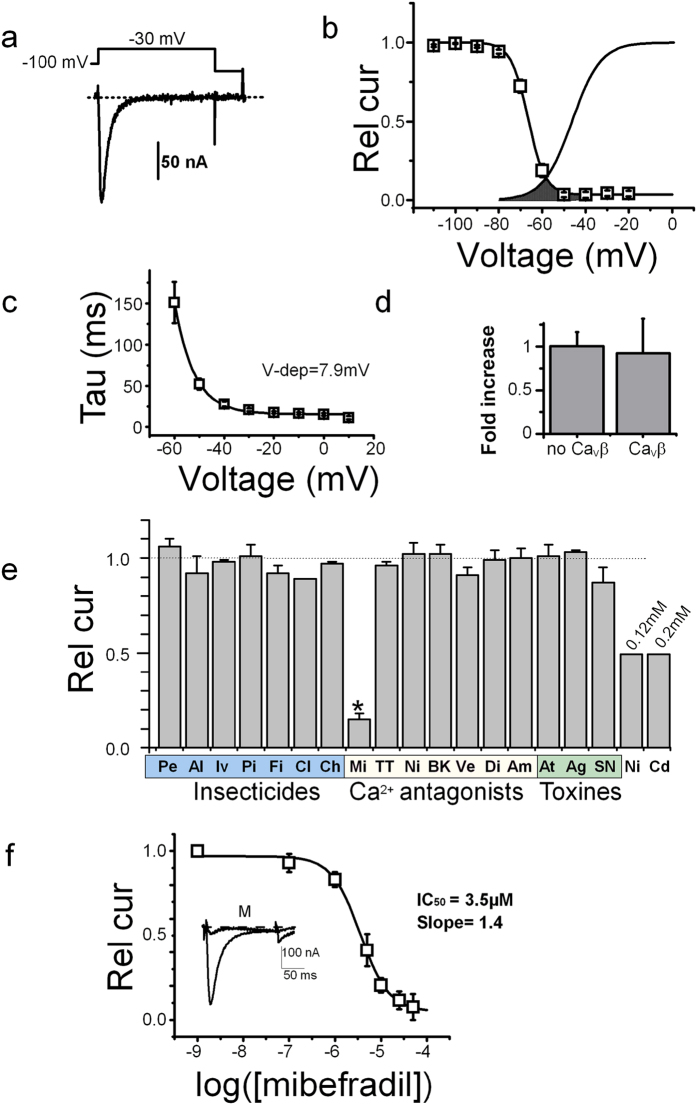
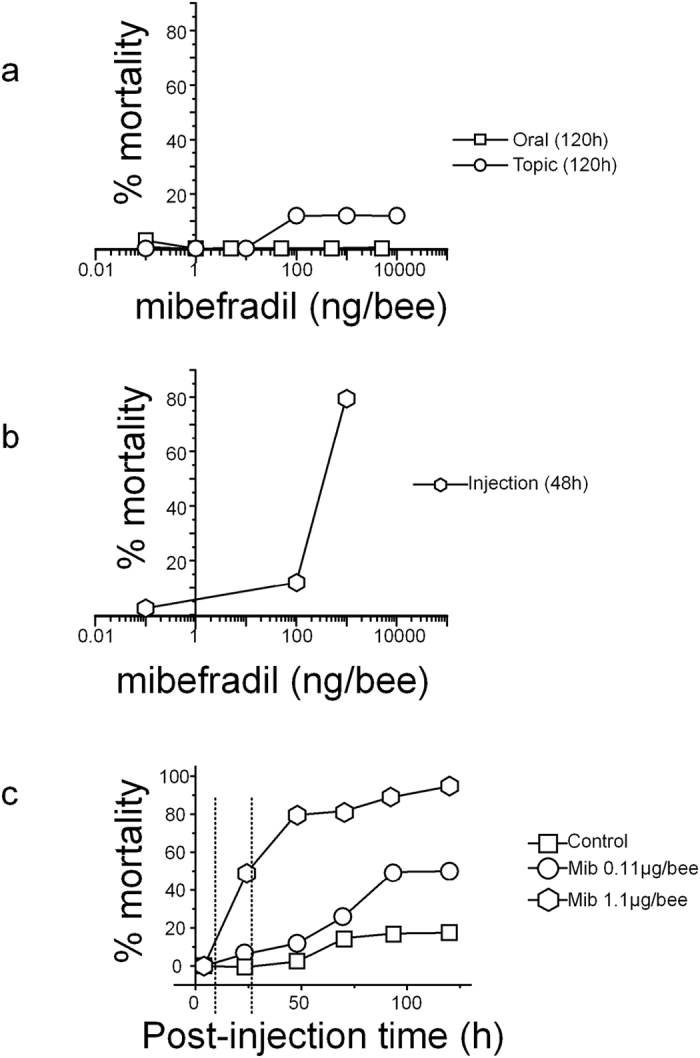
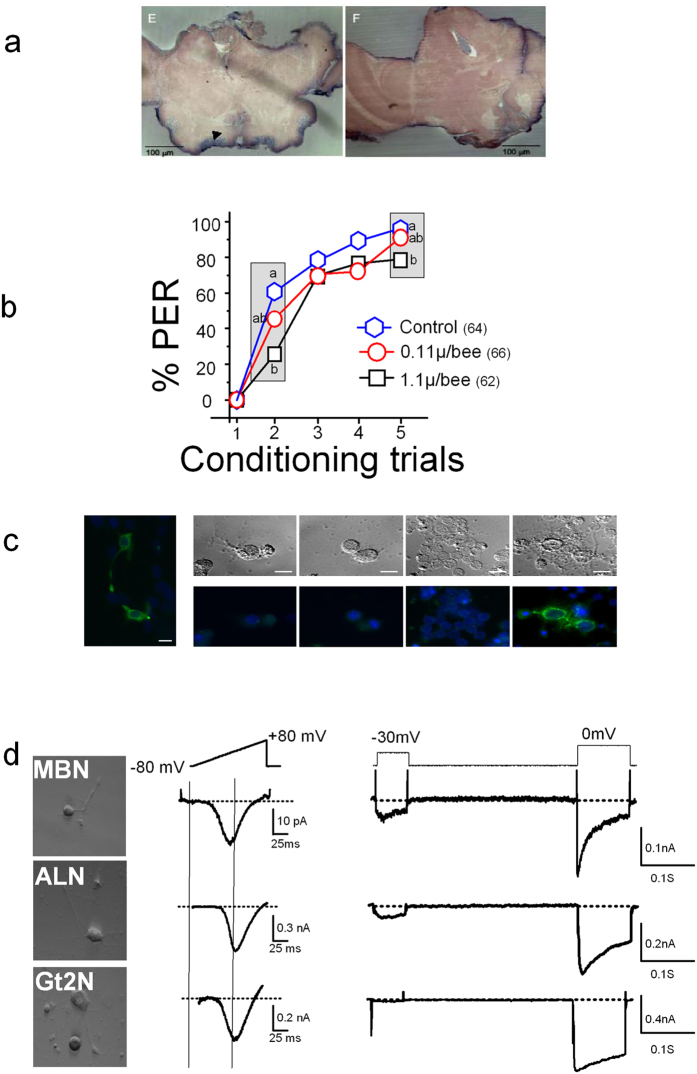
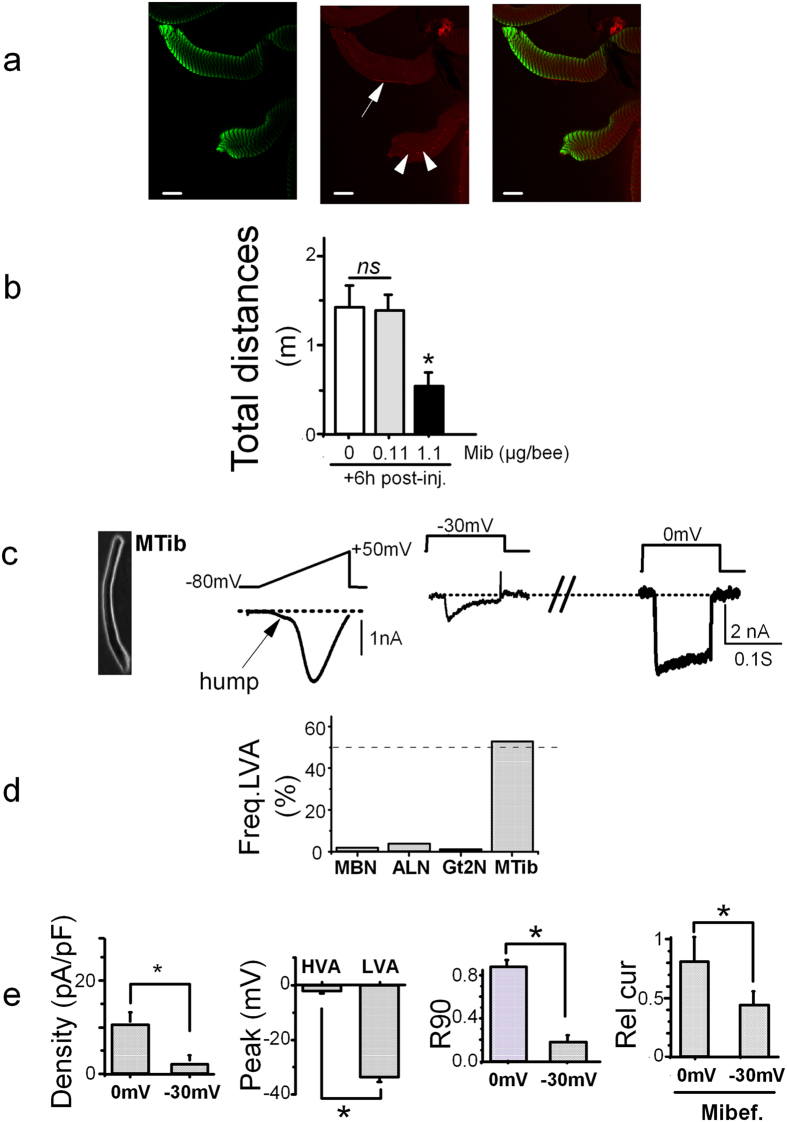
Voltage-gated Ca2+ channels are key transducers of cellular excitability and participate in several crucial physiological responses. In vertebrates, 10 Ca2+ channel genes, grouped in 3 families (CaV1, CaV2 and CaV3), have been described and characterized. Insects possess only one member of each family. These genes have been isolated in a limited number of species and very few have been characterized although, in addition to their crucial role, they may represent a collateral target for neurotoxic insecticides. We have isolated the 3 genes coding for the 3 Ca2+ channels expressed in Apis mellifera. This work provides the first detailed characterization of the honeybee T-type CaV3 Ca2+ channel and demonstrates the low toxicity of inhibiting this channel. Comparing Ca2+ currents recorded in bee neurons and myocytes with Ca2+ currents recorded in Xenopus oocytes expressing the honeybee CaV3 gene suggests native expression in bee muscle cells only. High-voltage activated Ca2+ channels could be recorded in the somata of different cultured bee neurons. These functional data were confirmed by in situ hybridization, immunolocalization and in vivo analysis of the effects of a CaV3 inhibitor. The biophysical and pharmacological characterization and the tissue distribution of CaV3 suggest a role in honeybee muscle function.
Conflict of interest statement
The authors declare no competing financial interests.
Figures
Similar articles
-
Evolutionary insights into T-type Ca2+ channel structure, function, and ion selectivity from the Trichoplax adhaerens homologue.J Gen Physiol. 2017 Apr 3;149(4):483-510. doi: 10.1085/jgp.201611683. Epub 2017 Mar 22. J Gen Physiol. 2017. PMID: 28330839 Free PMC article.
-
Ca-α1T, a fly T-type Ca2+ channel, negatively modulates sleep.Sci Rep. 2015 Dec 9;5:17893. doi: 10.1038/srep17893. Sci Rep. 2015. PMID: 26647714 Free PMC article.
-
T-type voltage gated calcium channels are involved in endothelium-dependent relaxation of mice pulmonary artery.Biochem Pharmacol. 2017 Aug 15;138:61-72. doi: 10.1016/j.bcp.2017.04.021. Epub 2017 Apr 22. Biochem Pharmacol. 2017. PMID: 28438566
-
[Cognitive Function and Calcium. Cognitive improvement through T type calcium channel stimulation].Clin Calcium. 2015 Feb;25(2):247-54. Clin Calcium. 2015. PMID: 25634050 Review. Japanese.
-
Regulation of the T-type Ca(2+) channel Cav3.2 by hydrogen sulfide: emerging controversies concerning the role of H2 S in nociception.J Physiol. 2016 Aug 1;594(15):4119-29. doi: 10.1113/JP270963. Epub 2016 Feb 25. J Physiol. 2016. PMID: 26804000 Free PMC article. Review.
Cited by
-
Honeybee CaV4 has distinct permeation, inactivation, and pharmacology from homologous NaV channels.J Gen Physiol. 2024 May 6;156(5):e202313509. doi: 10.1085/jgp.202313509. Epub 2024 Apr 1. J Gen Physiol. 2024. PMID: 38557788 Free PMC article.
-
Elementary calcium release events in the skeletal muscle cells of the honey bee Apis mellifera.Sci Rep. 2021 Aug 18;11(1):16731. doi: 10.1038/s41598-021-96028-w. Sci Rep. 2021. PMID: 34408196 Free PMC article.
-
Disinfectant dodecyl dimethyl benzyl ammonium chloride (DDBAC) disrupts gut microbiota, phospholipids, and calcium signaling in honeybees (Apis mellifera) at an environmentally relevant level.Environ Int. 2022 Dec;170:107639. doi: 10.1016/j.envint.2022.107639. Epub 2022 Nov 15. Environ Int. 2022. PMID: 36402032 Free PMC article.
-
Honey bees long-lasting locomotor deficits after exposure to the diamide chlorantraniliprole are accompanied by brain and muscular calcium channels alterations.Sci Rep. 2019 Feb 15;9(1):2153. doi: 10.1038/s41598-019-39193-3. Sci Rep. 2019. PMID: 30770849 Free PMC article.
-
Cardiotoxicity of the diamide insecticide chlorantraniliprole in the intact heart and in isolated cardiomyocytes from the honey bee.Sci Rep. 2024 Jun 28;14(1):14938. doi: 10.1038/s41598-024-65007-2. Sci Rep. 2024. PMID: 38942905 Free PMC article.
References
-
- Menzel R. The honeybee as a model for understanding the basis of cognition. Nat. Rev. Neurosci. 13, 758–768 (2012). - PubMed
-
- Laurent S., Masson C. & Jakob I. Whole-cell recording from honeybee olfactory receptor neurons: ionic currents, membrane excitability and odourant response in developing workerbee and drone. Eur J Neurosci 15, 1139–1152 (2002). - PubMed
-
- Grunewald B. Differential expression of voltage-sensitive K+ and Ca2+ currents in neurons of the honeybee olfactory pathway. J. Exp. Biol. 206, 117–129 (2003). - PubMed
Publication types
MeSH terms
Substances
LinkOut - more resources
Full Text Sources
Other Literature Sources
Miscellaneous
