. 2017 Feb 1:6:e18970.
doi: 10.7554/eLife.18970.

KEAP1 loss modulates sensitivity to kinase targeted therapy in lung cancer

Affiliations

KEAP1 loss modulates sensitivity to kinase targeted therapy in lung cancer

Elsa B Krall et al. Elife. .

Erratum in

  • Correction: KEAP1 loss modulates sensitivity to kinase targeted therapy in lung cancer.
    Krall EB, Wang B, Munoz DM, Ilic N, Raghavan S, Niederst MJ, Yu K, Ruddy DA, Aguirre AJ, Kim JW, Redig AJ, Gainor JF, Williams JA, Asara JM, Doench JG, Janne PA, Shaw AT, McDonald Iii RE, Engelman JA, Stegmeier F, Schlabach MR, Hahn WC. Krall EB, et al. Elife. 2017 Oct 31;6:e33173. doi: 10.7554/eLife.33173. Elife. 2017. PMID: 29087937 Free PMC article. No abstract available.

Abstract

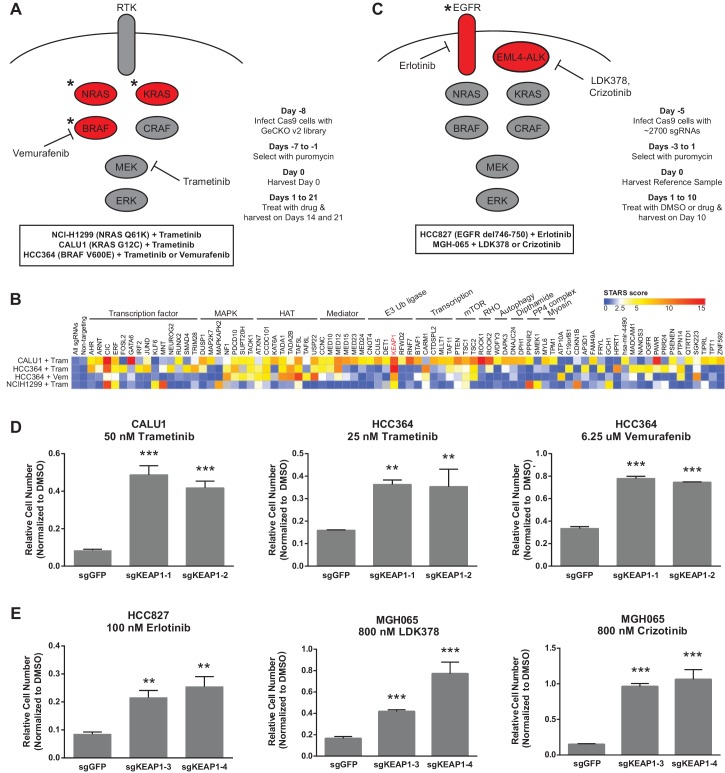
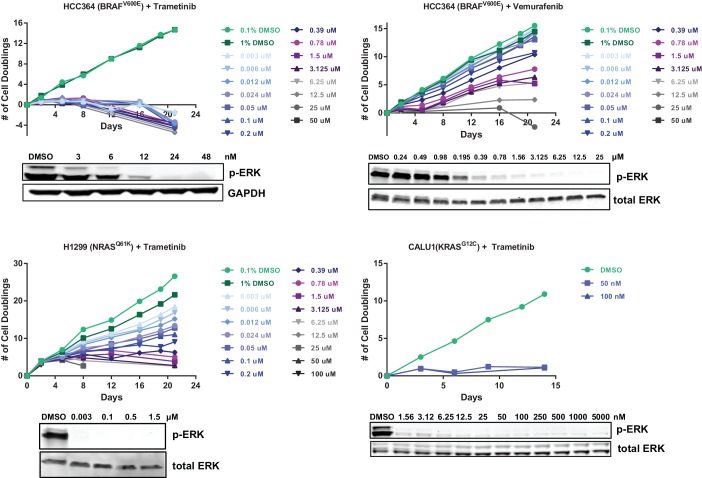
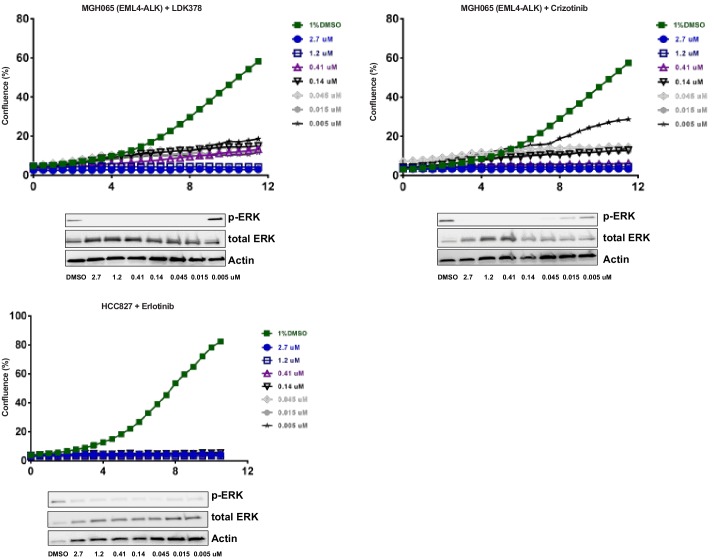
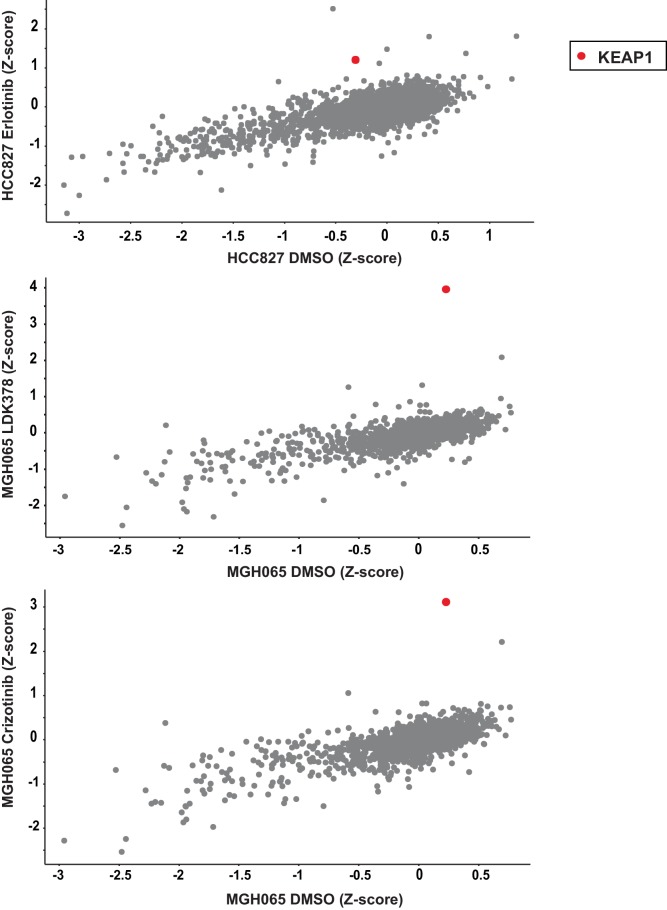
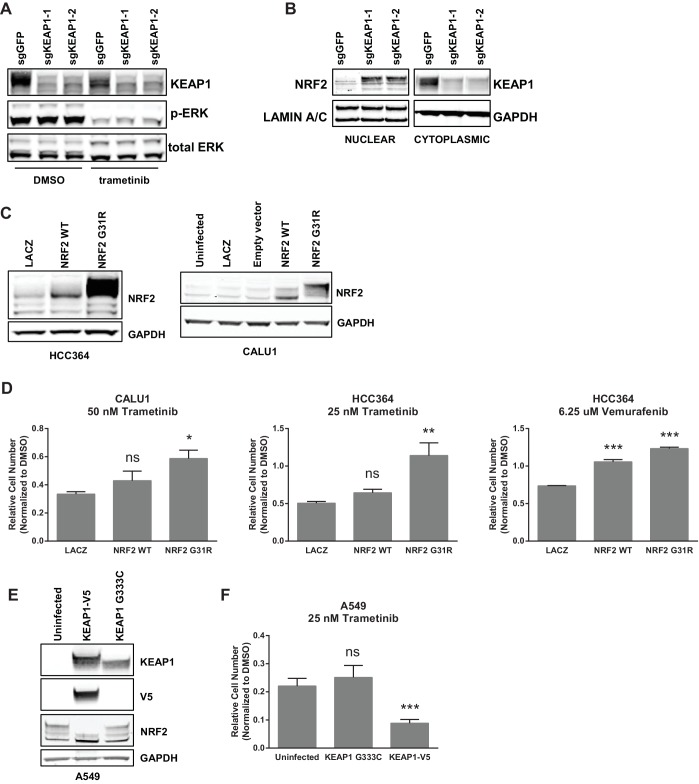
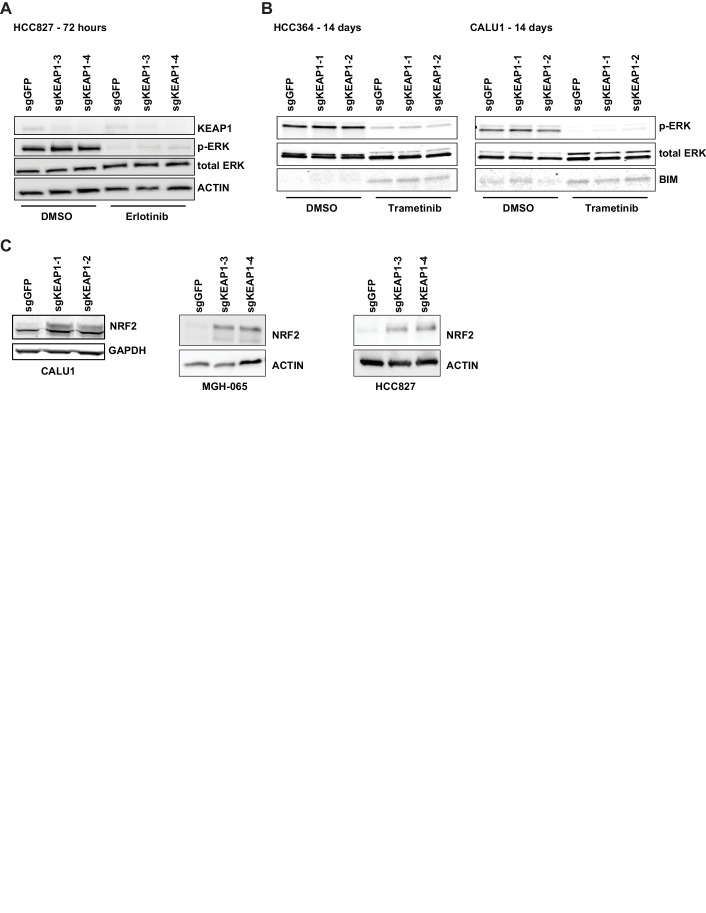
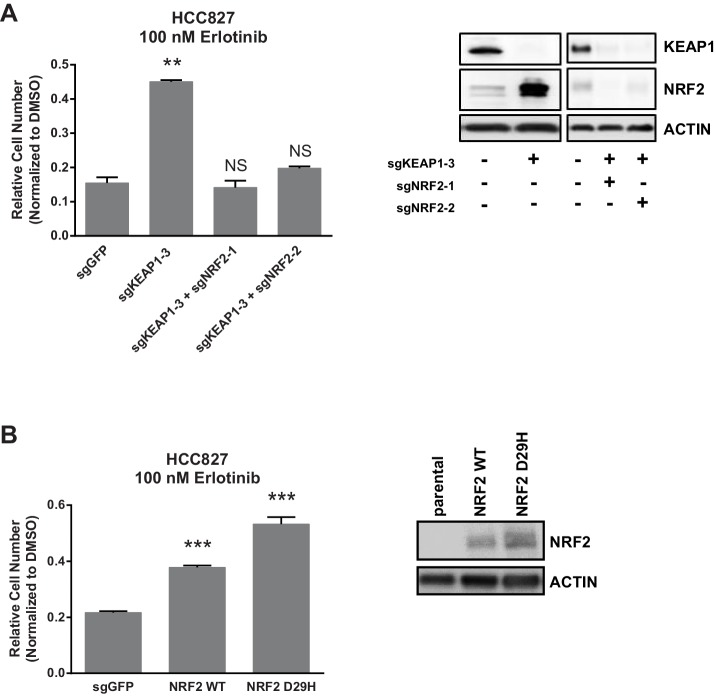
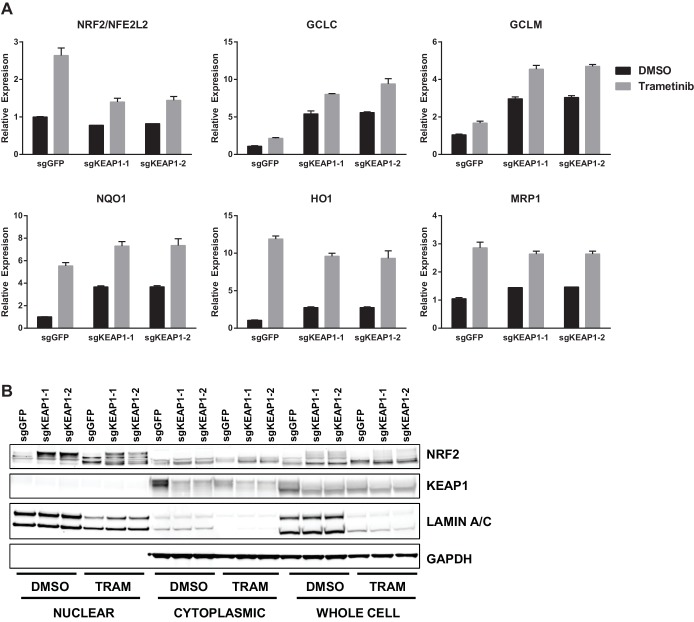
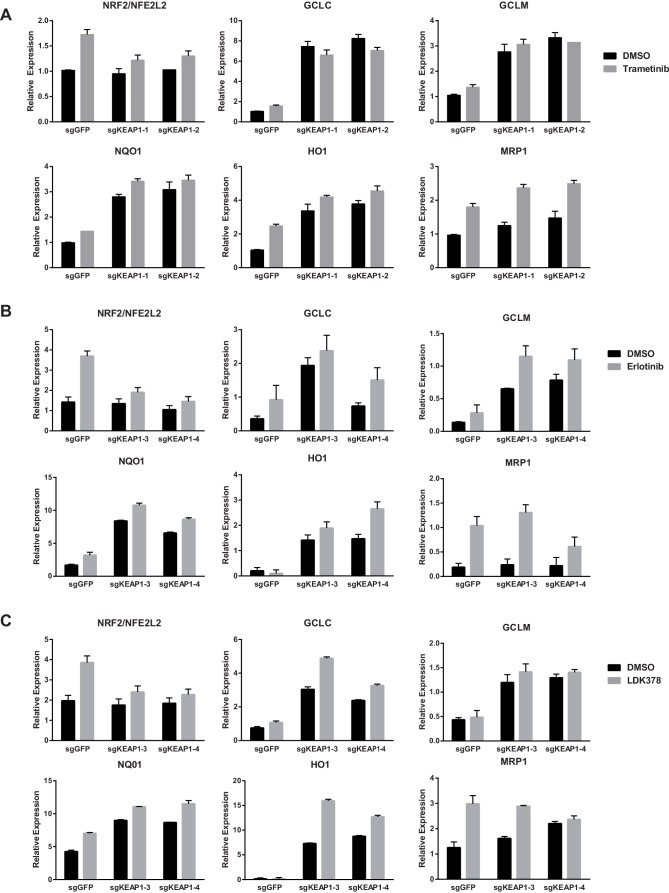
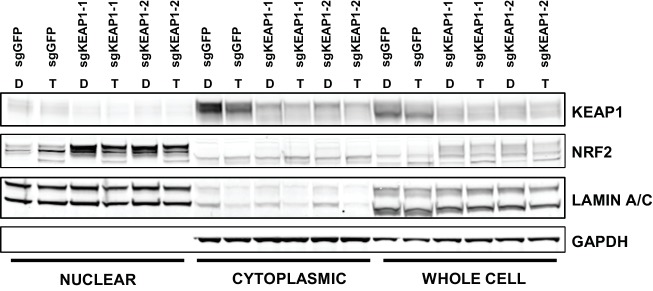
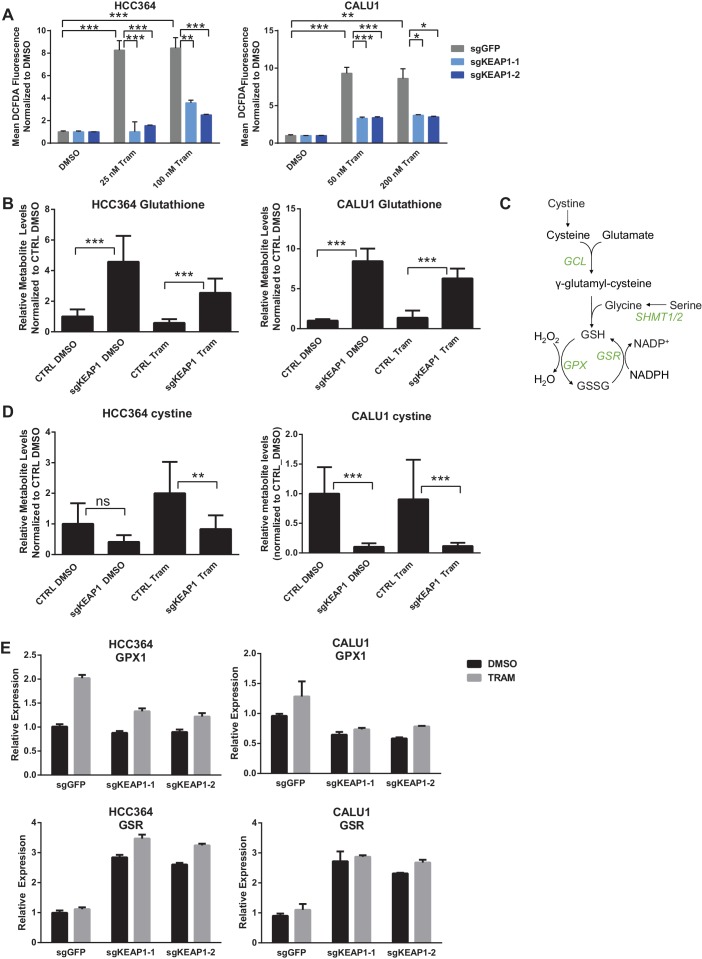
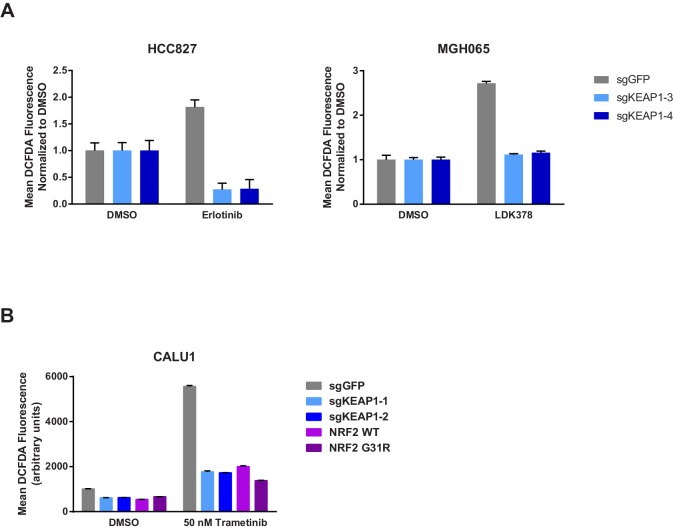
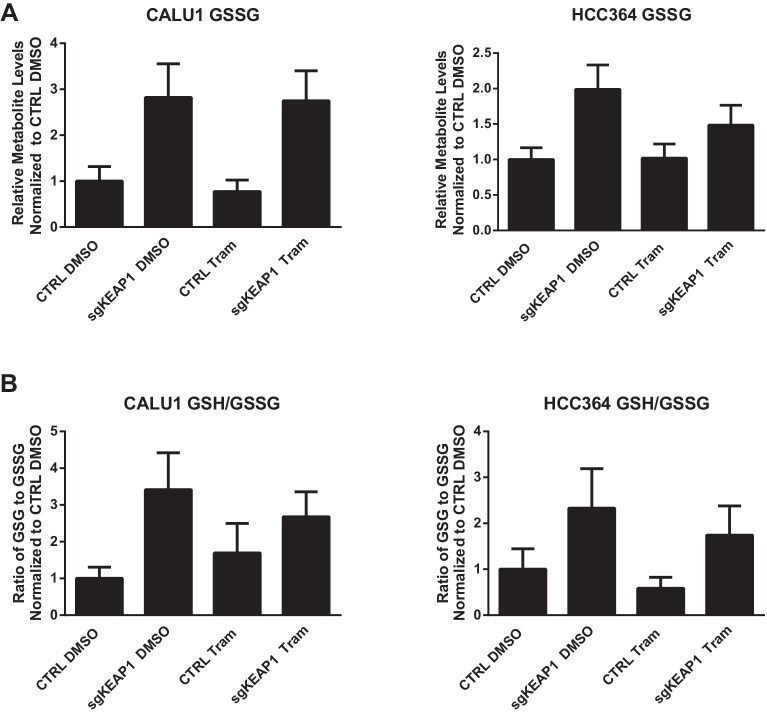
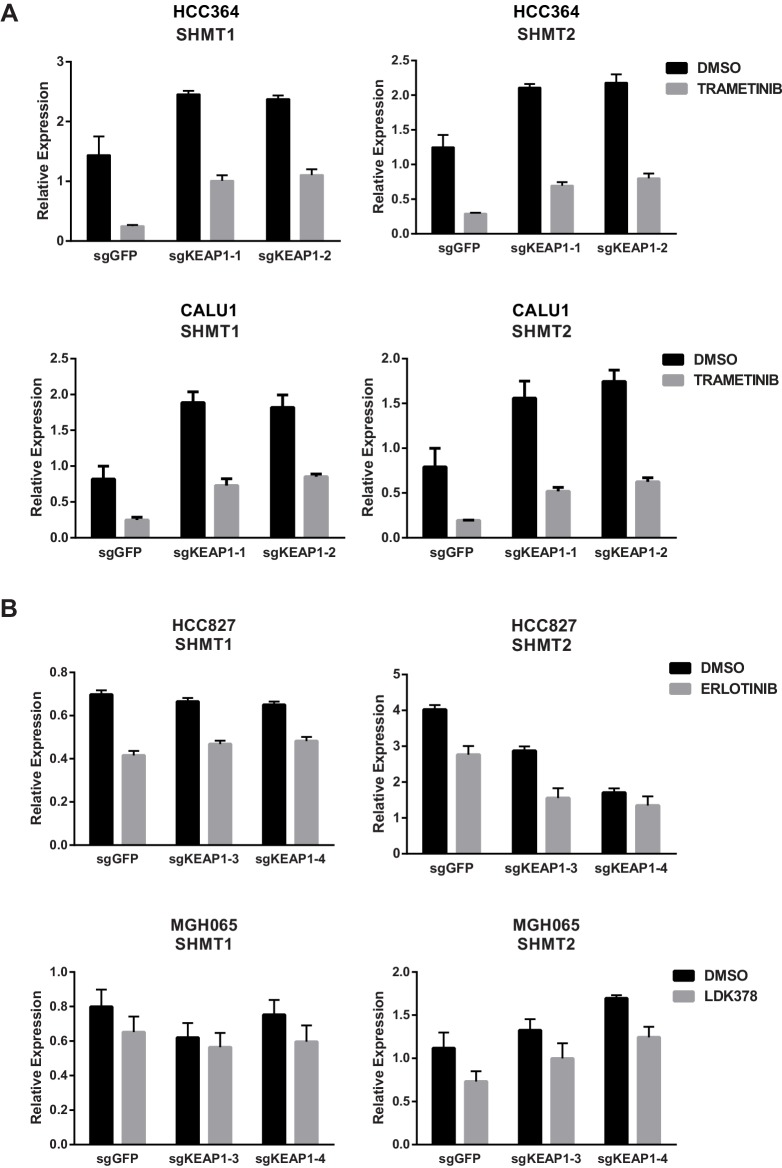
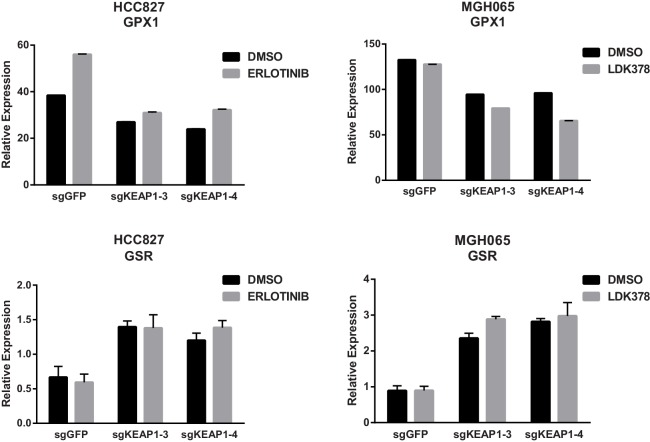
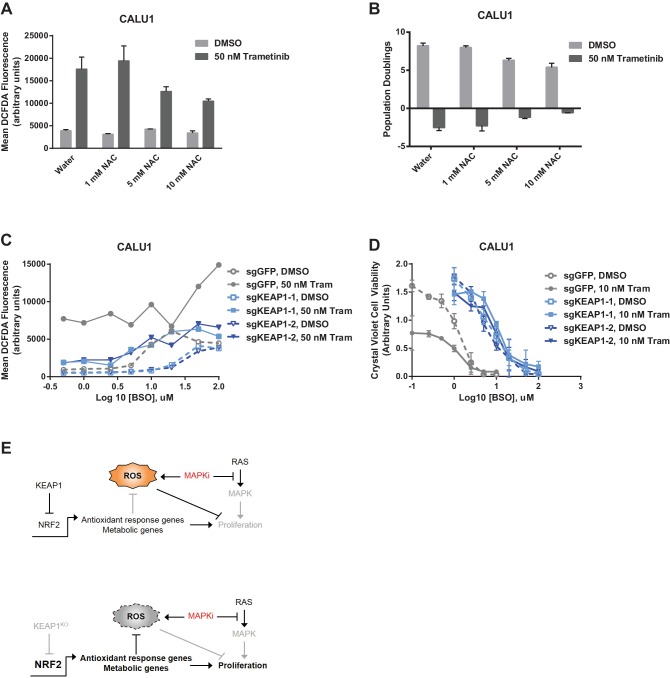
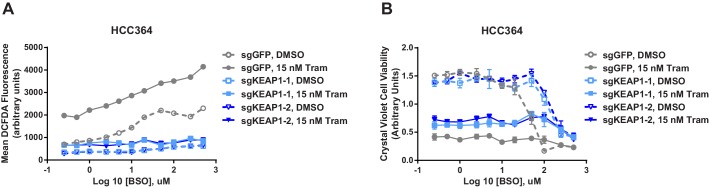
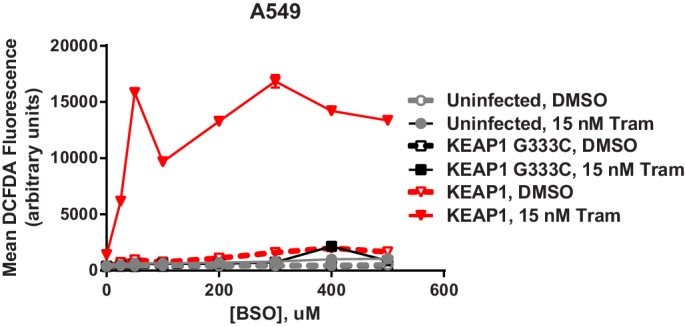
Inhibitors that target the receptor tyrosine kinase (RTK)/Ras/mitogen-activated protein kinase (MAPK) pathway have led to clinical responses in lung and other cancers, but some patients fail to respond and in those that do resistance inevitably occurs (Balak et al., 2006; Kosaka et al., 2006; Rudin et al., 2013; Wagle et al., 2011). To understand intrinsic and acquired resistance to inhibition of MAPK signaling, we performed CRISPR-Cas9 gene deletion screens in the setting of BRAF, MEK, EGFR, and ALK inhibition. Loss of KEAP1, a negative regulator of NFE2L2/NRF2, modulated the response to BRAF, MEK, EGFR, and ALK inhibition in BRAF-, NRAS-, KRAS-, EGFR-, and ALK-mutant lung cancer cells. Treatment with inhibitors targeting the RTK/MAPK pathway increased reactive oxygen species (ROS) in cells with intact KEAP1, and loss of KEAP1 abrogated this increase. In addition, loss of KEAP1 altered cell metabolism to allow cells to proliferate in the absence of MAPK signaling. These observations suggest that alterations in the KEAP1/NRF2 pathway may promote survival in the presence of multiple inhibitors targeting the RTK/Ras/MAPK pathway.

Keywords: CRISPR-Cas9; cancer biology; drug resistance; human; lung cancer.


Conflict of interest statement

WCH: A consultant and receives research support from Novartis. The other authors declare that no competing interests exist.

Figures

Figure 1.
Figure 1.. CRISPR-Cas9 genome scale drug resistance screens and validation that KEAP1-KO confers resistance.
(A,C) Pathway schematics and screening timelines. (B) Heatmap showing the STARS score for each gene with a score of at least five in at least one screen. (DE) Crystal violet colony formation assays. (D) 5000 CALU1 cells were treated with 50 nM trametinib for 17 days. 2000 HCC364 cells were treated with 25 nM trametinib or 6.25 uM vemurafenib for 21 days. (E) 10,000 HCC827 cells were treated with 100 nM erlotinib for 10 days. 10,000 MGH065 cells were treated with 800 nM LDK378 or 800 nM crizotinib for 10 days. Error bars represent the SD of the mean of triplicate wells. Experiments were performed two independent times and one representative experiment is shown. ***p=0.0001, **p<0.005. DOI: http://dx.doi.org/10.7554/eLife.18970.002
Figure 1—figure supplement 1.
Figure 1—figure supplement 1.. Optimization of genome scale screening conditions.
Cells were treated with the indicated concentration of drug. Cells were passaged or fresh media containing drug was added every 3–4 days. Cells were counted at each passage, and the number of population doublings is shown. In parallel, cells were treated with the indicated concentrations of drug for 90 min. Cell lysates were blotted with p-ERK antibody as a marker of BRAF/MEK inhibition. For the CRISPR-Cas9 screens, HCC364 cells were treated with 24 nM trametinib or 6.25 µM vemurafenib, H1299 cells were treated with 1.5 µM trametinib, and CALU1 cells were treated with 50 nM trametinib. DOI: http://dx.doi.org/10.7554/eLife.18970.003
Figure 1—figure supplement 2.
Figure 1—figure supplement 2.. Optimization of focused sgRNA library screening conditions.
Cells were treated with the indicated concentration of drug. Live cell time-lapse imaging was used to measure cell confluence to determine optimal drug concentrations. In parallel, cells were treated with the indicated concentrations of drug for 90 min. Cell lysates were blotted with p-ERK antibody as a marker of ALK or EGFR inhibition. For the CRISPR-Cas9 screens, MGH-065 cells were treated with 500 nM LDK378 or crizotinib. HCC827 cells were treated with 10 nM erlotinib. DOI: http://dx.doi.org/10.7554/eLife.18970.004
Figure 1—figure supplement 3.
Figure 1—figure supplement 3.. EGFR and ALK inhibitor resistance screens.
HCC827 cells were treated with 10 nM erlotinib. MGH-065 cells were treated with 500 nM LDK378 or crizotinib. DOI: http://dx.doi.org/10.7554/eLife.18970.005
Figure 1—figure supplement 4.
Figure 1—figure supplement 4.. Immunoblots showing deletion of KEAP1 by sgRNAs in HCC364, CALU1, MGH-065, and HCC827.
DOI: http://dx.doi.org/10.7554/eLife.18970.006
Figure 1—figure supplement 5.
Figure 1—figure supplement 5.. Crystal violet assays showing that KEAP1 loss confers resistance to afatinib and crizotinib.
1000 H1975 cells were treated with 100 nM afatinib for 10 days. 1000 H3122 cells were treated with 200 nM crizotinib for 14 days. Error bars represent the SD of the mean of triplicate wells. Experiments were performed two independent times and one representative experiment is shown. ***p<0.0001, **p<0.005. DOI: http://dx.doi.org/10.7554/eLife.18970.007
Figure 1—figure supplement 6.
Figure 1—figure supplement 6.. Erlotinib dose-response curves in HCC827.
(A) Dose-response curves were performed in HCC827 parental cells or the bulk population of sgKEAP1 cells. (B) Dose-response curves were performed in HCC827 parental cells or single-cell clones derived from sgKEAP1–4 cells. DOI: http://dx.doi.org/10.7554/eLife.18970.008
Figure 2.
Figure 2.. KEAP1-KO alters NRF2 levels.
(A) KEAP1-KO does not affect p-ERK. Whole cell lysates of HCC364-Cas9 cells with the indicated sgRNAs treated with DMSO or trametinib for 48 hr. (B) KEAP1-KO increases NRF2 levels. Nuclear and cytoplasmic fractions of HCC364 cells. (C) Immunoblot showing NRF2 expression in CALU1 and HCC364. (D) Crystal violet colony formation assays. 10,000 CALU1 cells expressing the indicated ORFs were treated with DMSO for 8 days or trametinib for 10 Days. 10,000 HCC364 cells expressing the indicated ORFs were treated with DMSO for 10 days or trametinib/vemurafenib for 21 days. Error bars represent the SD of the mean of triplicate wells. (E) Immunoblot showing expression of wildtype KEAP1 or KEAP1 G333C in A549 cells. (F) Expression of wildtype KEAP1 resensitized A549 cells to trametinib. 5000 cells were treated with 25 nM trametinib for 12 days. Error bars represent the SD of six wells. (AF) Experiments were performed two independent times, and one representative experiment is shown. ***p=0.0001, **p=0.0005, *p<0.002. DOI: http://dx.doi.org/10.7554/eLife.18970.009
Figure 2—figure supplement 1.
Figure 2—figure supplement 1.. KEAP1-KO alters NRF2 levels and does not activate ERK.
(A) Immunoblot showing p-ERK suppression in 72 hr erlotinib-treated sgKEAP1 HCC827 cells. (B) Immunoblot showing p-ERK suppression and BIM expression in 14 day trametinib-treated HCC364 and CALU1 cells. (C) Immunoblot showing increase in NRF2 upon KEAP1 knockout in CALU1, MGH-065, and HCC827. For MGH-065 and HCC827, loading controls are the same as in Figure 1—figure supplement 4. DOI: http://dx.doi.org/10.7554/eLife.18970.010
Figure 2—figure supplement 2.
Figure 2—figure supplement 2.. NRF2 is necessary and sufficient for resistance.
10,000 HCC827 cells were treated with 100 nM erlotinib for 10 days. Error bars represent the SD of the mean of triplicate wells. ***p<0.0001, **p<0.005. DOI: http://dx.doi.org/10.7554/eLife.18970.011
Figure 3.
Figure 3.. Trametinib treatment and KEAP1-KO increase NRF2 activity.
(A) Expression of NFE2L2/NRF2 mRNA and NRF2 target genes in HCC364 treated with DMSO or trametinib for 72 hr. Error bars represent the SD of the mean of three biological replicates. (B) HCC364 cells treated with DMSO or trametinib for 72 hr. TRAM, trametinib. (A,B) Experiments were performed two independent times, and one representative experiment is shown. DOI: http://dx.doi.org/10.7554/eLife.18970.012
Figure 3—figure supplement 1.
Figure 3—figure supplement 1.. Expression of NFE2L2/NRF2 mRNA and NRF2 target genes in (A) CALU1 cells, (B) HCC827 cells, or (C) MGH-065 cells treated with DMSO or the indicated drug for 72 hr.
Error bars represent the SD of the mean of biological triplicates. DOI: http://dx.doi.org/10.7554/eLife.18970.013
Figure 3—figure supplement 2.
Figure 3—figure supplement 2.. CALU1 cells treated with DMSO or trametinib for 72 hr.
D, DMSO; T, trametinib. DOI: http://dx.doi.org/10.7554/eLife.18970.014
Figure 4.
Figure 4.. KEAP1-KO reduces trametinib-induced ROS through increased glutathione synthesis.
(A) HCC364 or CALU1 cells were treated with DMSO or trametinib for 72 hr. ROS was measured by DCFDA fluorescence. Error bars represent SD of the mean of two biological replicates. (B, D) CALU1 or HCC364 cells were treated with DMSO or trametinib for 72 hr and metabolites were measured by liquid chromatography tandem mass spectrometry. Error bars represent SD of eight replicates. (C) Glutathione synthesis pathway. (E) Expression of GPX1 and GSR in HCC364 and CALU1 cells treated with DMSO or trametinib for 72 hr. Error bars represent the SD of the mean of three biological replicates. ***p<0.005, **p<0.01, *p<0.02. DOI: http://dx.doi.org/10.7554/eLife.18970.015
Figure 4—figure supplement 1.
Figure 4—figure supplement 1.. KEAP1-KO reduces drug-induced ROS.
(A) HCC827 or MGH065 cells or (B) CALU1 cells were treated with DMSO or drug for 72 hr. ROS was measured by DCFDA fluorescence. Error bars represent SD of the mean of two biological replicates. DOI: http://dx.doi.org/10.7554/eLife.18970.016
Figure 4—figure supplement 2.
Figure 4—figure supplement 2.. Glutathione levels in HCC364 and CALU1 cells.
Oxidized glutathione (glutathione disulfide, GSSG) is increased in KEAP1-KO cells, but the ratio of reduced to oxidized glutathione (GSH/GSSG) is higher in KEAP1-KO cells. CALU1 and HCC364 cells were treated with DMSO or trametinib for 72 hr, and metabolites were measured by liquid chromatography tandem mass spectrometry. Error bars represent SD of eight replicates. DOI: http://dx.doi.org/10.7554/eLife.18970.017
Figure 4—figure supplement 3.
Figure 4—figure supplement 3.. KEAP1-KO alters expression of SHMT1/2 in some cell lines.
(A) Expression of SHMT1/2 in HCC364 and CALU1 cells treated with DMSO or trametinib for 72 hr. (B) Expression of SHMT1/2 in HCC827 or MGH-065 cells treated with erlotinib or LDK378 for 72 hr. Error bars represent SD of the mean of three biological replicates. DOI: http://dx.doi.org/10.7554/eLife.18970.018
Figure 4—figure supplement 4.
Figure 4—figure supplement 4.. KEAP1-KO alters expression of GPX1 and GSR.
Expression of GPX1 and GSR in HCC827 or MGH-065 cells treated with erlotinib or LDK378 for 72 hr. Error bars represent SD of the mean of three biological replicates. DOI: http://dx.doi.org/10.7554/eLife.18970.019
Figure 5.
Figure 5.. Altering ROS levels affects cell survival.
(A, B) CALU1 cells were treated with DMSO or 50 nM trametinib and the indicated concentration of N-acetyl cysteine (NAC) for 16 days. (A) ROS was measured by DCFDA assay. Error bars represent SD of two replicates. (B) Population doublings of trametinib-treated cells compared to DMSO-treated cells. Error bars represent SD of two replicates. (C) KEAP1-KO reduces trametinib- and BSO-induced ROS in CALU1 cells. Cells were treated for 72 hr, and ROS was measured by DCFDA assay. Error bars represent SD of two replicates. (D) KEAP1-KO increases cell viability in CALU1 cells treated with trametinib and BSO. 20,000 CALU1 cells were treated with DMSO plus BSO for 7 days or trametinib plus BSO for 12 days. Error bars represent SD of triplicate wells. (E) Model of how KEAP1-KO confers resistance to trametinib. MAPK pathway inhibitors turn off MAPK signaling and also induce ROS, leading to low level activation of NRF2. Upon KEAP1 loss, NRF2 activity further increases, altering expression of genes involved in the antioxidant response and metabolism, allowing for proliferation in the absence of MAPK signaling. DOI: http://dx.doi.org/10.7554/eLife.18970.020
Figure 5—figure supplement 1.
Figure 5—figure supplement 1.. KEAP1-KO reduces ROS and increases viability in the presence of BSO.
(A) KEAP1-KO reduces trametinib- and BSO-induced ROS in HCC364 cells. Cells were treated for 72 hr, and ROS was measured by DCFDA assay. Error bars represent SD of two replicates. (B) KEAP1-KO increases cell viability in HCC364 cells treated with trametinib abd BSO. Cells were treated with DMSO plus BSO for 6 days or trametinib plus BSO for 10 days. Error bars represent SD of triplicate wells. DOI: http://dx.doi.org/10.7554/eLife.18970.021
Figure 5—figure supplement 2.
Figure 5—figure supplement 2.. Expression of WT KEAP1 but not G333C in KEAP1-null A549 cells increases trametinib- and BSO-induced ROS.
Cells were treated for 72 hr. Error bars represent SD of two replicates. DOI: http://dx.doi.org/10.7554/eLife.18970.022
Figure 5—figure supplement 3.
Figure 5—figure supplement 3.. KEAP1-KO alters cell metabolism.
Expression of NRF2 metabolic target genes in (A) CALU1 cells treated with DMSO or trametinib for 72 hr, (B) HCC364 cells treated with DMSO or trametinib for 72 hr, (C) HCC827 cells treated with DMSO or erlotinib for 72 hr and (D) MGH-065 cells treated with DMSO or LDK378 for 72 hr. Error bars represent SD of three biological replicates. DOI: http://dx.doi.org/10.7554/eLife.18970.023
Figure 6.
Figure 6.. Alterations in the KEAP1/NRF2 pathway alter tumor growth in vivo.
Growth of HCC827 sgGFP and sgKEAP1 cells in vivo. HCC827 sgGFP or sgKEAP1 cells were implanted bilaterally and treatment was initiated when average tumor volume reached 100–200 mm3. Data represent mean ± SD (n = 12). DOI: http://dx.doi.org/10.7554/eLife.18970.024

References

    1. Aguirre AJ, Meyers RM, Weir BA, Vazquez F, Zhang CZ, Ben-David U, Cook A, Ha G, Harrington WF, Doshi MB, Kost-Alimova M, Gill S, Xu H, Ali LD, Jiang G, Pantel S, Lee Y, Goodale A, Cherniack AD, Oh C, Kryukov G, Cowley GS, Garraway LA, Stegmaier K, Roberts CW, Golub TR, Meyerson M, Root DE, Tsherniak A, Hahn WC. Genomic copy number dictates a Gene-Independent cell response to CRISPR/Cas9 Targeting. Cancer Discovery. 2016;6:914–929. doi: 10.1158/2159-8290.CD-16-0154. - DOI - PMC - PubMed
    1. Balak MN, Gong Y, Riely GJ, Somwar R, Li AR, Zakowski MF, Chiang A, Yang G, Ouerfelli O, Kris MG, Ladanyi M, Miller VA, Pao W. Novel D761Y and common secondary T790M mutations in epidermal growth factor receptor-mutant lung adenocarcinomas with acquired resistance to kinase inhibitors. Clinical Cancer Research. 2006;12:6494–6501. doi: 10.1158/1078-0432.CCR-06-1570. - DOI - PubMed
    1. Barretina J, Caponigro G, Stransky N, Venkatesan K, Margolin AA, Kim S, Wilson CJ, Lehár J, Kryukov GV, Sonkin D, Reddy A, Liu M, Murray L, Berger MF, Monahan JE, Morais P, Meltzer J, Korejwa A, Jané-Valbuena J, Mapa FA, Thibault J, Bric-Furlong E, Raman P, Shipway A, Engels IH, Cheng J, Yu GK, Yu J, Aspesi P, de Silva M, Jagtap K, Jones MD, Wang L, Hatton C, Palescandolo E, Gupta S, Mahan S, Sougnez C, Onofrio RC, Liefeld T, MacConaill L, Winckler W, Reich M, Li N, Mesirov JP, Gabriel SB, Getz G, Ardlie K, Chan V, Myer VE, Weber BL, Porter J, Warmuth M, Finan P, Harris JL, Meyerson M, Golub TR, Morrissey MP, Sellers WR, Schlegel R, Garraway LA. The cancer cell line Encyclopedia enables predictive modelling of anticancer drug sensitivity. Nature. 2012;483:603–607. doi: 10.1038/nature11003. - DOI - PMC - PubMed
    1. Berns K, Horlings HM, Hennessy BT, Madiredjo M, Hijmans EM, Beelen K, Linn SC, Gonzalez-Angulo AM, Stemke-Hale K, Hauptmann M, Beijersbergen RL, Mills GB, van de Vijver MJ, Bernards R. A functional genetic approach identifies the PI3K pathway as a major determinant of trastuzumab resistance in breast cancer. Cancer Cell. 2007;12:395–402. doi: 10.1016/j.ccr.2007.08.030. - DOI - PubMed
    1. Blumenschein GR, Smit EF, Planchard D, Kim DW, Cadranel J, De Pas T, Dunphy F, Udud K, Ahn MJ, Hanna NH, Kim JH, Mazieres J, Kim SW, Baas P, Rappold E, Redhu S, Puski A, Wu FS, Jänne PA. A randomized phase II study of the MEK1/MEK2 inhibitor trametinib (GSK1120212) compared with docetaxel in KRAS-mutant advanced non-small-cell lung cancer (NSCLC)†. Annals of Oncology. 2015;26:894–901. doi: 10.1093/annonc/mdv072. - DOI - PMC - PubMed

Publication types

MeSH terms