. 2017 Feb 16;542(7641):344-347.
doi: 10.1038/nature21074. Epub 2017 Feb 1.

Mega-evolutionary dynamics of the adaptive radiation of birds

Affiliations

Mega-evolutionary dynamics of the adaptive radiation of birds

Christopher R Cooney et al. Nature. .

Erratum in

Abstract

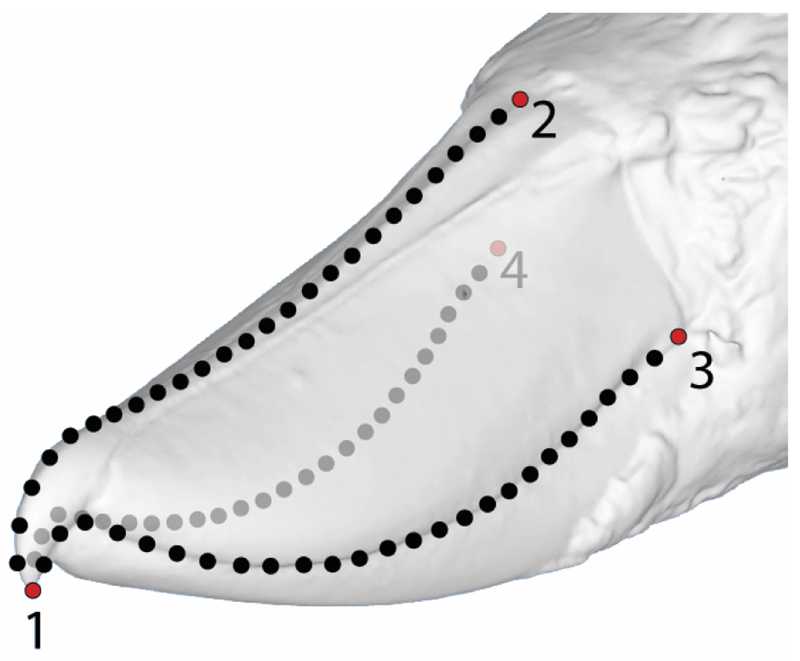
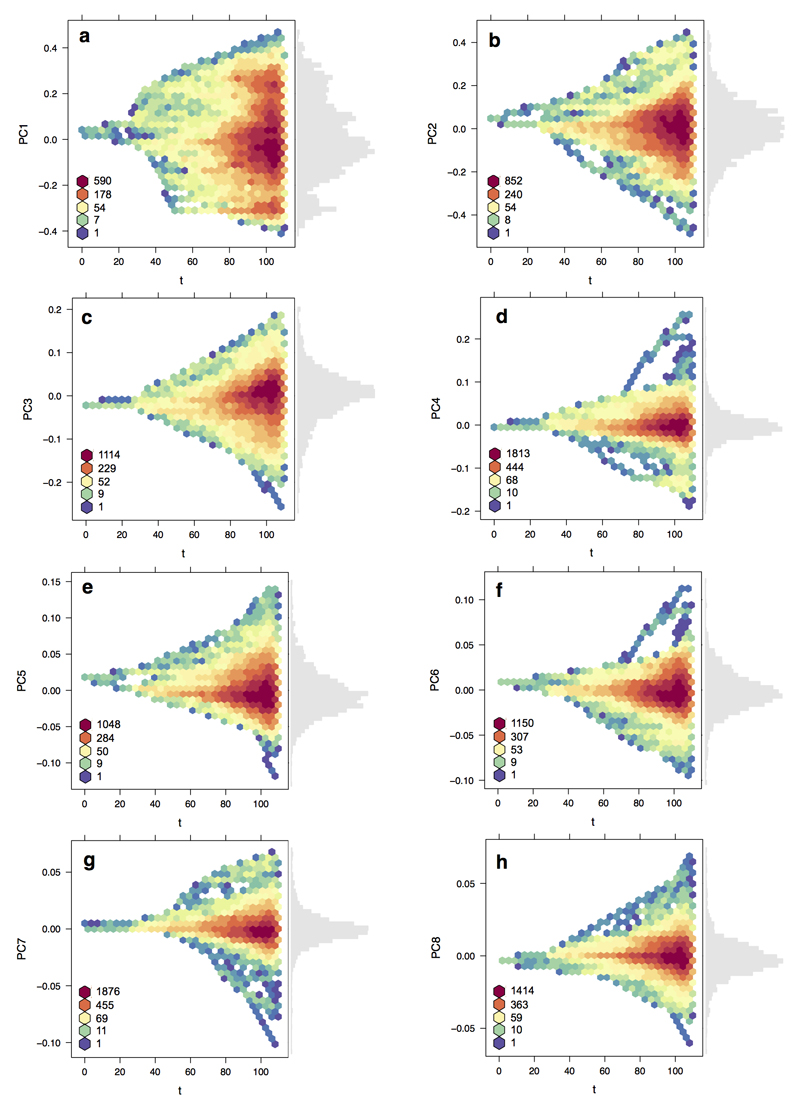
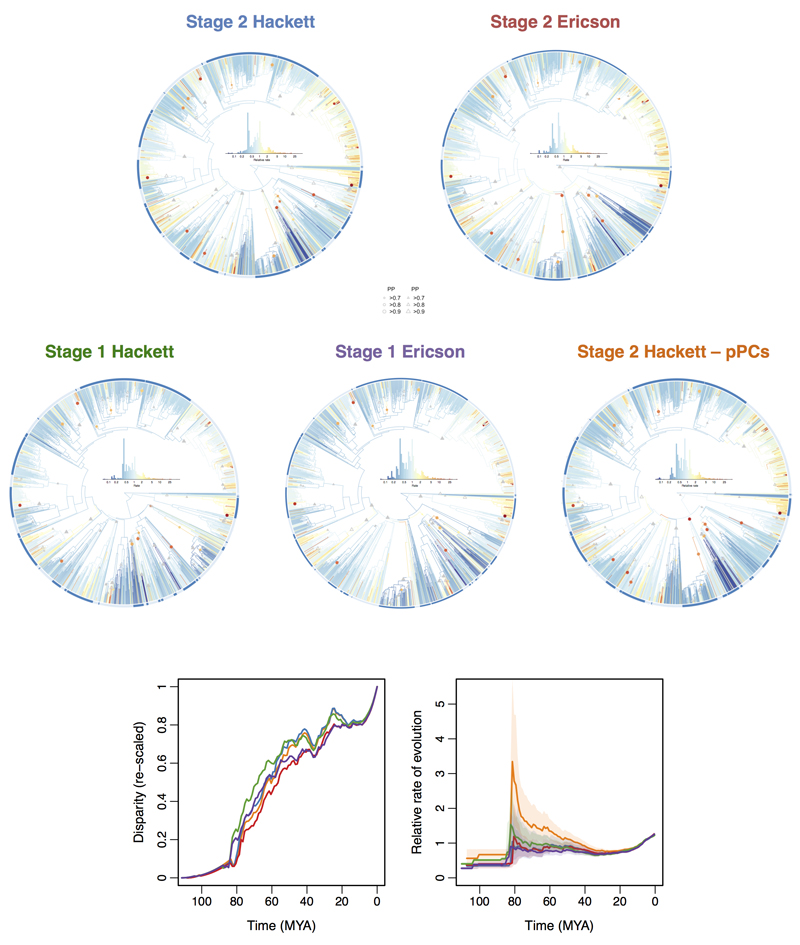
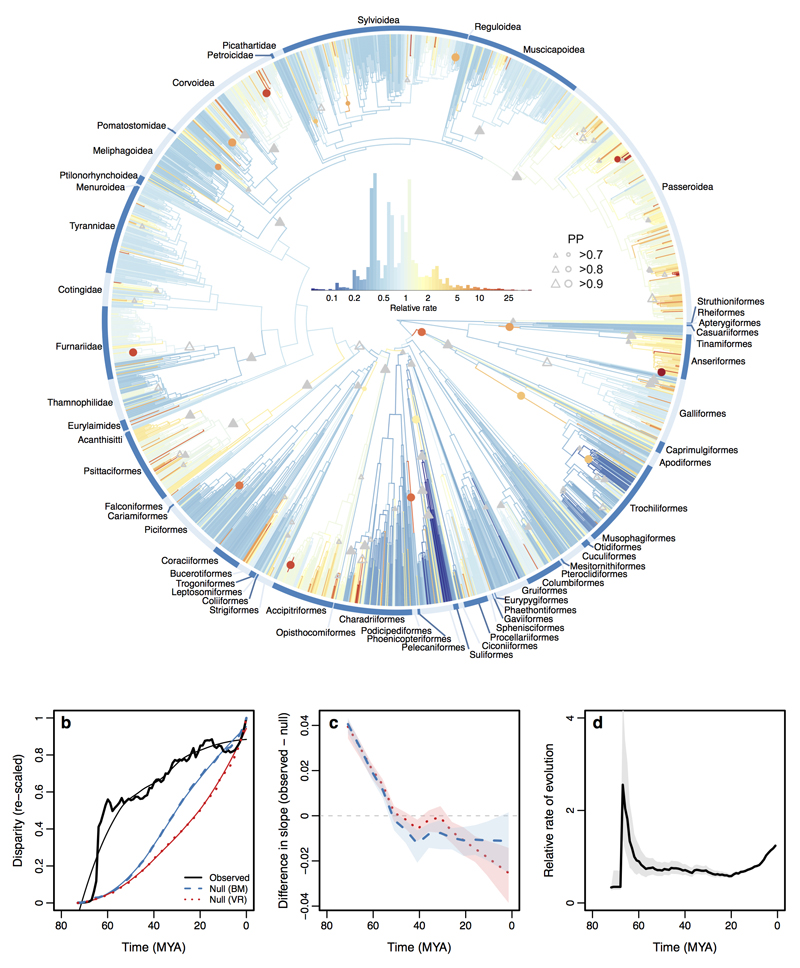
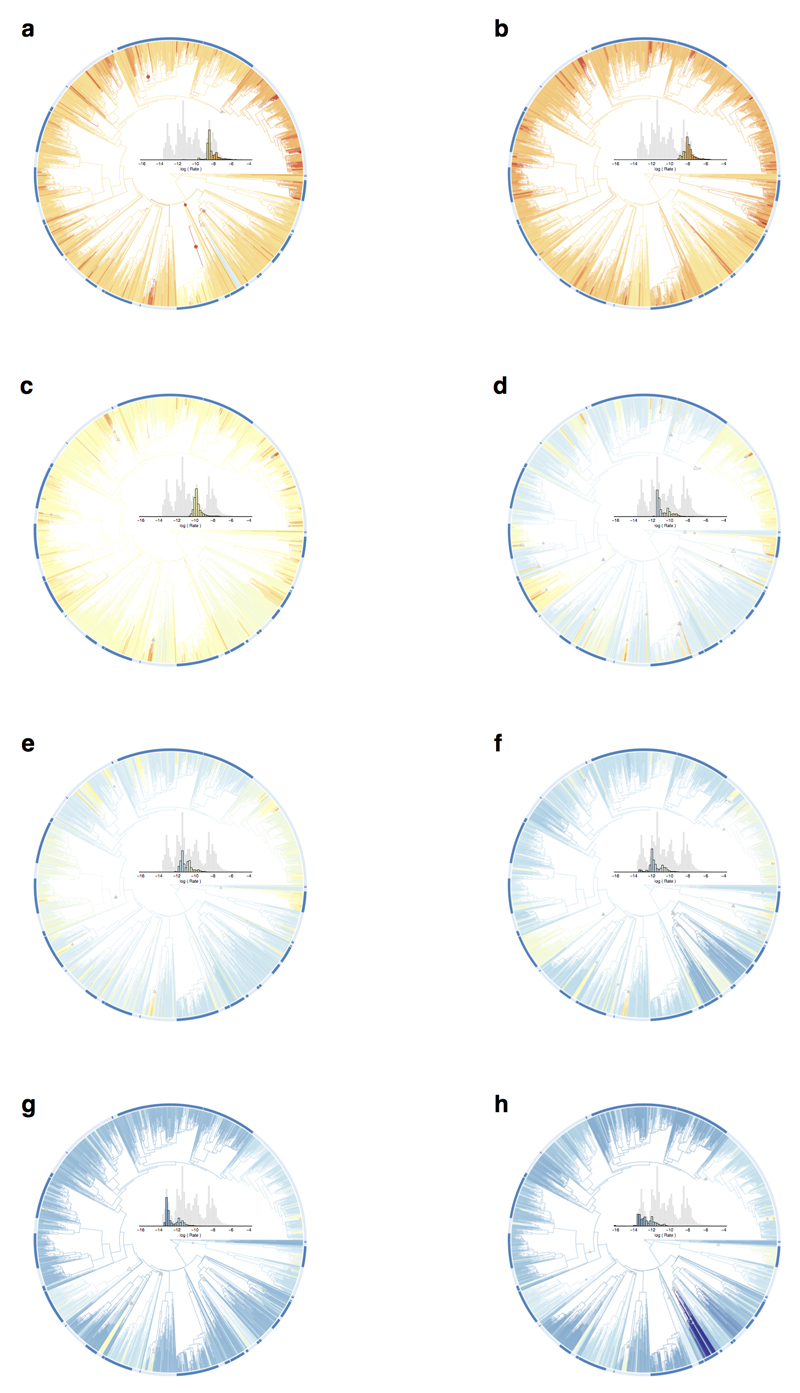
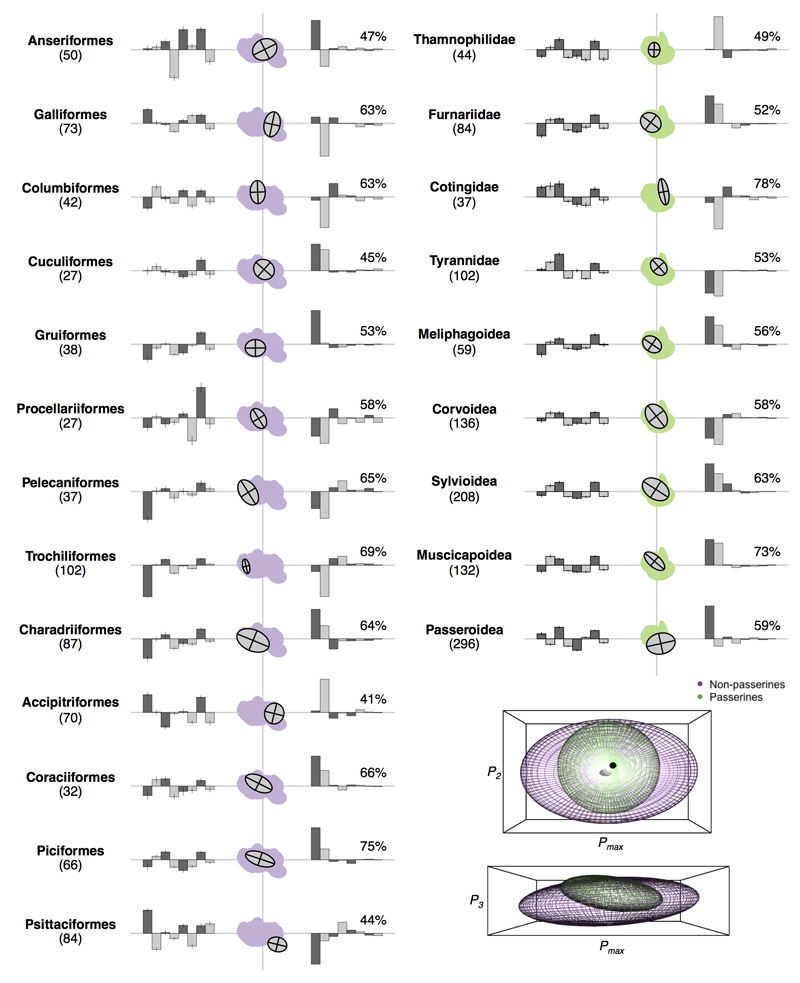
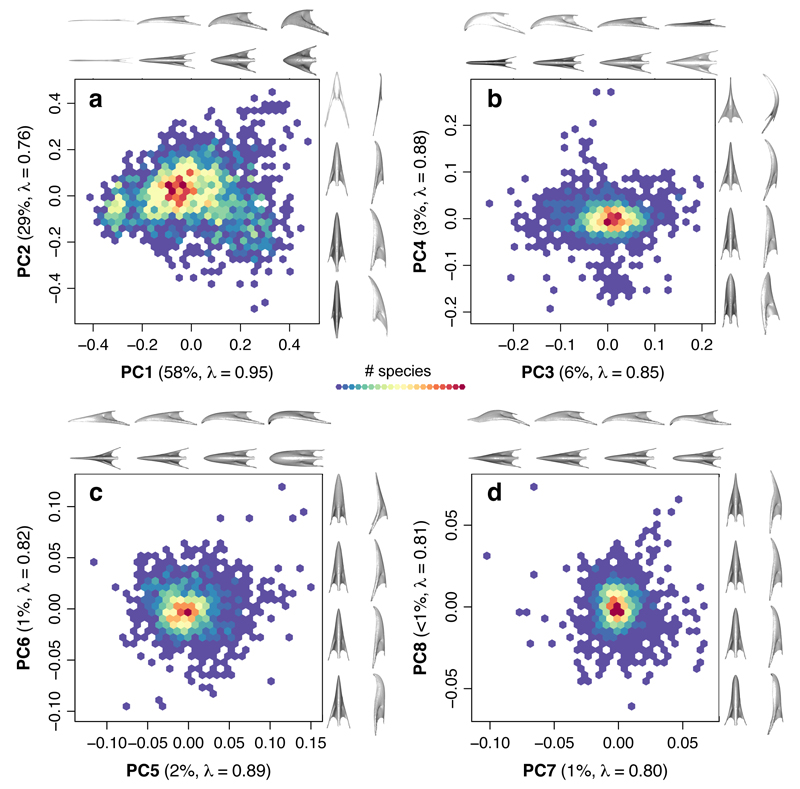
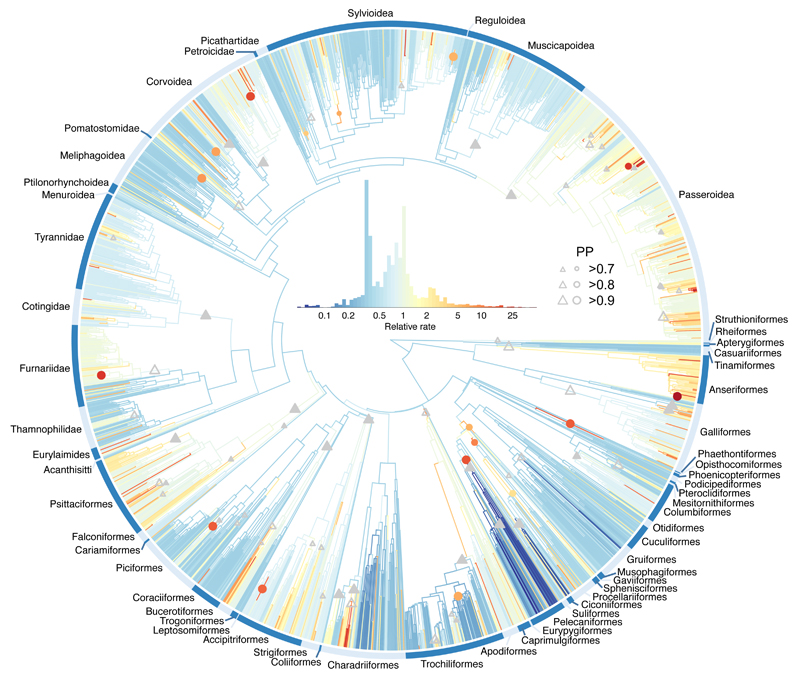
The origin and expansion of biological diversity is regulated by both developmental trajectories and limits on available ecological niches. As lineages diversify, an early and often rapid phase of species and trait proliferation gives way to evolutionary slow-downs as new species pack into ever more densely occupied regions of ecological niche space. Small clades such as Darwin's finches demonstrate that natural selection is the driving force of adaptive radiations, but how microevolutionary processes scale up to shape the expansion of phenotypic diversity over much longer evolutionary timescales is unclear. Here we address this problem on a global scale by analysing a crowdsourced dataset of three-dimensional scanned bill morphology from more than 2,000 species. We find that bill diversity expanded early in extant avian evolutionary history, before transitioning to a phase dominated by packing of morphological space. However, this early phenotypic diversification is decoupled from temporal variation in evolutionary rate: rates of bill evolution vary among lineages but are comparatively stable through time. We find that rare, but major, discontinuities in phenotype emerge from rapid increases in rate along single branches, sometimes leading to depauperate clades with unusual bill morphologies. Despite these jumps between groups, the major axes of within-group bill-shape evolution are remarkably consistent across birds. We reveal that macroevolutionary processes underlying global-scale adaptive radiations support Darwinian and Simpsonian ideas of microevolution within adaptive zones and accelerated evolution between distinct adaptive peaks.


Conflict of interest statement

Competing financial interests. None.

Figures

Extended Data Figure 1
Extended Data Figure 1. Positions of landmarks and semilandmarks.
The image shows a 3D scan of a shoebill (Balaeniceps rex) bill marked up with four fixed landmarks (numbered red points) and three semi-landmark curves along the dorsal profile (from points 1 to 2) and tomial edges (left from point 1 to 3 and right from point 1 to 4). Each curve consists of 25 semi-landmarks (black points).
Extended Data Figure 2
Extended Data Figure 2. Morphospace density through time.
Plots show the filling of avian bill morphospace through time (n = 2028 species) for PCs a,1; b, 2; c, 3; d, 4; e, 5; f, 6; g, 7; and h, 8. Densities were calculated in 1 million year time slices based on univariate rate heterogeneous models of trait evolution using a stage 2 Hackett MCC tree from www.birdtree.org. The scale runs from low density (blue) to high density (red), indicating the extent of niche packing through time in different regions of bill morphospace. For each axis the frequency distribution of PC scores among species is also shown (grey bars).
Extended Data Figure 3
Extended Data Figure 3. Comparison of multivariate rates of bill shape evolution and disparity through time for alternative datasets.
The plot shows estimates of the mean relative multivariate rate of bill shape evolution for four alternative versions of the avian phylogeny and also when using phylogenetic Principal Components (pPCs) (see Methods). Shown below are plots comparing estimates of disparity and rates through time derived from each dataset. For stage 2 trees n = 2028 species and for stage 1 trees n = 1627 species.
Extended Data Figure 4
Extended Data Figure 4. Multivariate rates of bill shape evolution for a composite tree based on the Prum et al. backbone.
The avian phylogeny coloured according to estimates of the mean relative multivariate rate of bill shape evolution. Grey triangles show the stem branch of clades with support for whole clade shifts in evolutionary rate. Coloured circles show rate shifts on individual internal branches (colour indicates the rate estimate). The relative size of triangles and circles indicates the posterior probability (PP) of a rate shift. Filled and open triangles distinguish between shifts on the focal node (filled) and shifts that occur either at the focal node or on one of the two immediate daughter nodes (open).
Extended Data Figure 5
Extended Data Figure 5. Phylogenetic mapping of univariate rates of bill shape evolution.
The plots shows the avian phylogeny of all taxa included in the study (n = 2028 species) with branches coloured on a common scale across panels according to estimates of the univariate rate of bill shape evolution. a, PC1, b, PC2, c, PC3, d, PC4, e, PC5, f, PC6, g, PC7, h, PC8.
Extended Data Figure 6
Extended Data Figure 6. Morphospaces of avian higher taxa.
Pairwise scatterplots of PCs 1 and 2, 3 and 4, 5 and 6, and 7 and 8 showing focal higher taxa (non-passerines, purple; passerines, green) against total avian morphospace (grey). Values in parentheses show the number of species sampled.
Extended Data Figure 7
Extended Data Figure 7. Morphological subspaces of the P of avian higher taxa.
The figure shows representations of P for avian higher taxa with ≥20 species sampled. First column: distribution of species values on each of the first eight raw PCs showing variation in morphospace centroid for each higher taxon. Second column: two-dimensional subspace for each taxon with non-passerine (purple) and passerine (green) subspaces. The x- and y-axes follow the global leading (Pmax) and secondary eigenvectors. Third column: percentage of total variance explained and individual PC loadings onto each taxon specific Pmax. Inset: three-dimensional subspace for all non-passerines (purple) and passerines (green). Values in parentheses show the number of species sampled.
Figure 1
Figure 1. Bird bill morphospace density plots.
PC axes 1-8 are shown as pairwise scatterplots, along with warps representing the change in bill shape (n = 2028 species) along each axis in dorsal and lateral views. Each axis is labeled with the proportion of variance explained and estimates of phylogenetic signal (Pagel’s λ). The colour scale refers to the number of species in 20 bins with minimum and maximum richness of a, 1-23 b, 1-72 c, 1-64, and d, 1-98 species, respectively.
Figure 2
Figure 2. Morphospace filling through time.
a, Accumulation of multivariate disparity through time in 1 million time slices (thick black line: observed data; thin black line: after LOESS smoothing; blue lines: constant rate null model; red lines: variable rate null model). b, Comparison of slopes (estimated in 5 million year windows) of the LOESS-smoothed observed data and null models. Differences in slope above and below zero indicate dominance of morphospace expansion versus morphospace packing respectively. Shading indicates 95% confidence intervals. c, Mean relative rates of evolution with 95% confidence intervals (grey) through time.
Figure 3
Figure 3. Multivariate rates of bill shape evolution.
The avian phylogeny (n = 2028 species) coloured by estimates of the mean relative multivariate rate of bill shape evolution. Grey triangles show the stem branch of clades with support for whole clade shifts in evolutionary rate. Coloured circles show rate shifts on individual internal branches (colour indicates the rate estimate). The relative size of triangles and circles indicates the posterior probability (PP) of a rate shift. Triangles distinguish shifts on the focal node (filled) and shifts at the focal node or on one of its two daughter nodes (open).

Comment in

References

    1. Bright JA, Marugan-Lobon J, Cobb SN, Rayfield EJ. The shapes of bird beaks are highly controlled by nondietary factors. Proc Natl Acad Sci U S A. 2016;113:5352–5357. doi: 10.1073/pnas.1602683113. - DOI - PMC - PubMed
    1. Lamichhaney S, et al. Evolution of Darwin's finches and their beaks revealed by genome sequencing. Nature. 2015;518:371–375. - PubMed
    1. Phillimore AB, Price TD. Density-dependent cladogenesis in birds. PLoS Biol. 2008;6:e71. doi: 10.1371/journal.pbio.0060071. - DOI - PMC - PubMed
    1. Simpson GG. Tempo and mode in evolution. Columbia University Press; 1944.
    1. Ezard TH, Purvis A. Environmental changes define ecological limits to species richness and reveal the mode of macroevolutionary competition. Ecol Lett. 2016 doi: 10.1111/ele.12626. - DOI - PMC - PubMed

Publication types