

Colonization in North American Arid Lands: The Journey of Agarito (Berberis trifoliolata) Revealed by Multilocus Molecular Data and Packrat Midden Fossil Remains
- PMID: 28146559
- PMCID: PMC5287450
- DOI: 10.1371/journal.pone.0168933
Colonization in North American Arid Lands: The Journey of Agarito (Berberis trifoliolata) Revealed by Multilocus Molecular Data and Packrat Midden Fossil Remains
Abstract
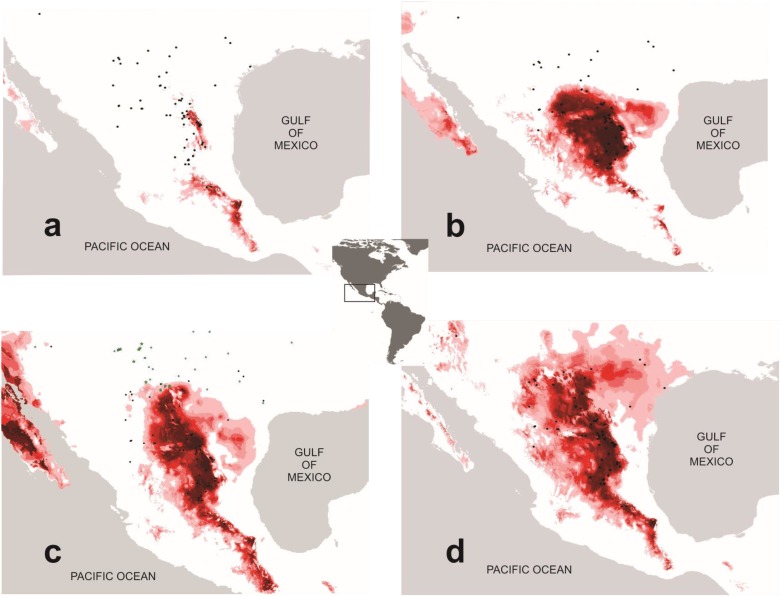
Here we conduct research to understand the evolutionary history of a shrubby species known as Agarito (Berberis trifoliolata), an endemic species to the Chihuahuan Desert. We identify genetic signatures based on plastid DNA and AFLP markers and perform niche modelling and spatial connectivity analyses as well as niche modelling based on records in packrats to elucidate whether orogenic events such as mountain range uplift in the Miocene or the contraction/expansion dynamics of vegetation in response to climate oscillations in the Pliocene/Pleistocene had an effect on evolutionary processes in Agarito. Our results of current niche modelling and palaeomodelling showed that the area currently occupied by Berberis trifoliolata is substantially larger than it was during the Last Interglacial period and the Last Glacial Maximum. Agarito was probably confined to small areas in the Northeastern and gradually expanded its distribution just after the Last Glacial Maximum when the weather in the Chihuahuan Desert and adjacent regions became progressively warmer and drier. The most contracted range was predicted for the Interglacial period. Populations remained in stable areas during the Last Glacial Maximum and expanded at the beginning of the Holocene. Most genetic variation occured in populations from the Sierra Madre Oriental. Two groups of haplotypes were identified: the Mexican Plateau populations and certain Northeastern populations. Haplogroups were spatially connected during the Last Glacial Maximum and separated during interglacial periods. The most important prediction of packrat middens palaeomodelling lies in the Mexican Plateau, a finding congruent with current and past niche modelling predictions for agarito and genetic results. Our results corroborate that these climate changes in the Pliocene/Pleistocene affected the evolutionary history of agarito. The journey of agarito in the Chihuahuan Desert has been dynamic, expanding and contracting its distribution range and currently occupying the largest area in its history.
Conflict of interest statement
The authors have declared that no competing interests exist.
Figures


References
-
- Axelrod DI (1950) The evolution of desert vegetation in western North America. Carnegie Institution of Washington Publication 590: 215–306.
-
- Webb SD (1977) A history of savanna vertebrates in the New World. Part I: North America. Annu Rev Ecol Syst 8: 355–380.
-
- Dregne HE (1984) North American deserts In: El-Baz F, editor. Deserts and arid lands. Martinus Nijhoff Publishers; The Hague, Boston, Lancaster: pp. 145–156.
-
- Graham RW, Mead JI (1987) Environmental fluctuation and evolution of mammalian faunas during the last deglaciation in North America In: Ruddiman WF, Wright HE Jr., editors. North America and Adjacent Oceans during the Last Deglaciation. The Geological Society of America, Boulder.
MeSH terms
Substances
LinkOut - more resources
Full Text Sources
Other Literature Sources
Miscellaneous
