. 2017 Feb 1;13(2):e1006191.
doi: 10.1371/journal.ppat.1006191. eCollection 2017 Feb.

Selective expansion of high functional avidity memory CD8 T cell clonotypes during hepatitis C virus reinfection and clearance

Affiliations

Selective expansion of high functional avidity memory CD8 T cell clonotypes during hepatitis C virus reinfection and clearance

Mohamed S Abdel-Hakeem et al. PLoS Pathog. .

Abstract

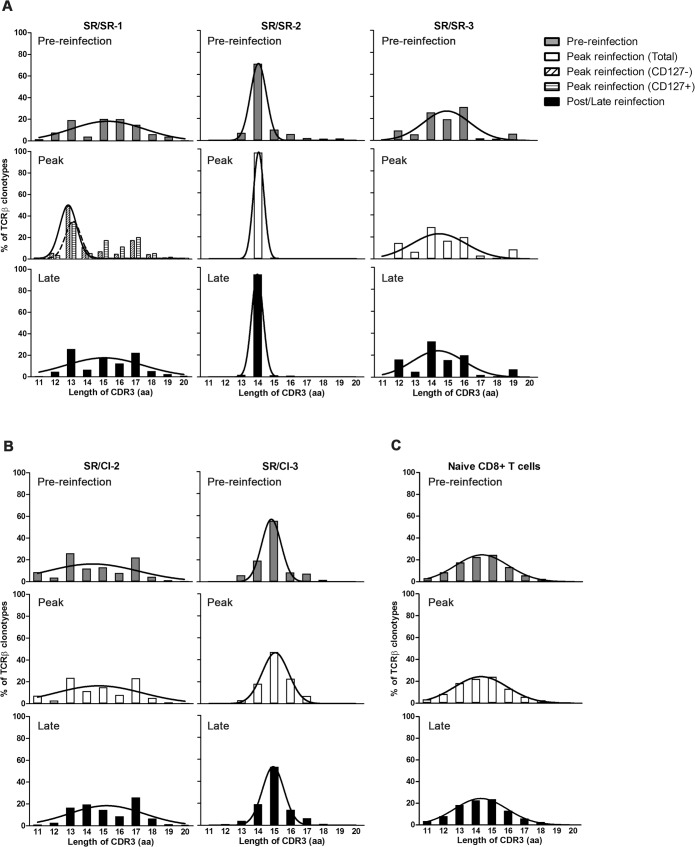
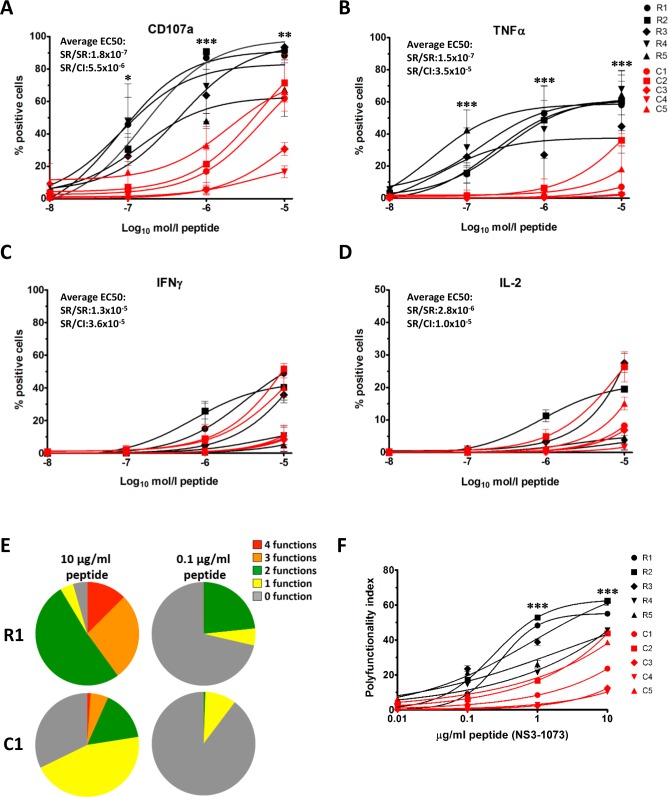
The dynamics of the memory CD8 T cell receptor (TCR) repertoire upon virus re-exposure and factors governing the selection of TCR clonotypes conferring protective immunity in real life settings are poorly understood. Here, we examined the dynamics and functionality of the virus-specific memory CD8 TCR repertoire before, during and after hepatitis C virus (HCV) reinfection in patients who spontaneously resolved two consecutive infections (SR/SR) and patients who resolved a primary but failed to clear a subsequent infection (SR/CI). The TCR repertoire was narrower prior to reinfection in the SR/SR group as compared to the SR/CI group and became more focused upon reinfection. CD8 T cell clonotypes expanding upon re-exposure and associated with protection from viral persistence were recruited from the memory T cell pool. Individual CD8 T cell lines generated from the SR/SR group exhibited higher functional avidity and polyfunctionality as compared to cell lines from the SR/CI group. Our results suggest that protection from viral persistence upon HCV reinfection is associated with focusing of the HCV-specific CD8 memory T cell repertoire from which established cell lines showed high functional avidity. These findings are applicable to vaccination strategies aiming at shaping the protective human T cell repertoire.


Conflict of interest statement

The authors have declared that no competing interests exist.

Figures

Fig 1
Fig 1. HCV-specific tetramer+ CD8 T-cell clonotypes mobilized during the reinfection episode were exclusively recruited from the pre-existing memory population.
The top ten dominant clonotypes (frequency ≥1%) isolated directly ex vivo from (A) three SR/SR patients and (B) two SR/CI patients followed-up longitudinally during reinfection episode at pre-reinfection, peak expansion and post/late reinfection (all five patients). For patient SR/SR-1, at the peak of reinfection, cells were sorted according to CD127 expression into CD127- population (effector population, diagonally stripped white bar) and CD127+ (memory population, horizontally stripped white bar). Tetramers used in each patient are indicated between brackets next to the patient number.
Fig 2
Fig 2. Narrowly focused epitope-specific CD8 T cell repertoire in SR/SR patients.
Distribution of the different categories (dominant, sub-dominant, low-abundance and lowest abundance clonotypes in blue, red, yellow and violet, respectively) with respect to the total clonotypes forming the epitope-specific CD8 T cell repertoire for three SR/SR patients at pre-reinfection, peak and post reinfection episode (A) patient SR/SR-1 (B) SR/SR-2 and (C) SR/SR-3. Patient SR/SR-3 was followed-up during primary HCV infection, as well. The pie charts in the upper rows show the percentage of each category with respect to the total repertoire. The percentages are represented by numbers inside the pie. The numbers between brackets around the pie charts represent the number of unique clonotypes forming each category. The sliced pie charts in blue in the lower rows represent the dissection of the individual clonotypes forming the dominant category, with the frequency of the three most dominant clonotypes indicated in white inside the corresponding slice.
Fig 3
Fig 3. Highly diverse epitope-specific CD8 T cell repertoire in SR/CI patients.
Pie charts showing the distribution of the different categories of clonotypes forming the epitope-specific CD8 T cell repertoire at pre-, peak and late during the reinfection episode in patient SR/CI-2 (A) and SR/CI-3 (B). The pie charts in the upper rows show the percentage of each category (dominant, sub-dominant, low-abundance and lowest abundance clonotypes in blue, red, yellow and violet, respectively) with respect to the total clonotypes. The percentages of each category are represented by numbers inside the pie. The numbers between brackets around the pie charts represent the number of unique clonotypes forming each category. The sliced pie charts in blue in the lower rows represent the dissection of the individual clonotypes forming the dominant category, with the frequency of the three most dominant clonotypes indicated in white inside the corresponding slice.
Fig 4
Fig 4. Decreased diversity, richness and evenness during reinfection in SR/SR patients.
Simpson Diversity of the repertoires shown for all samples at the different time points (A) or longitudinally stratified by patient (B). Calculated as described by Simpson [24], with 0 defined as infinite diversity and 1 as no diversity. Richness index of the repertoires shown for all samples at the different time points (C) or longitudinally stratified by patient (D) represent the number of unique sequences as a ratio of the number of input cells. Evenness of the repertoires shown for all samples at the different time points (E) or longitudinally stratified by patient (F), representing the relative abundance of each clonotypes forming one repertoire. (G) Morisita Horn index calculated with the ImmunoSeq 3.0 tool to compare pre-reinfection with peak reinfection time points as well as peak reinfection with late reinfection time points.
Fig 5
Fig 5. CDR3-length distribution for epitope-specific CD8 T cell repertoire in SR/SR patients as compared to SR/CI patients.
Distribution of the CDR3 amino acid (aa) lengths frequencies for the clonotypes forming the epitope-specific CD8 T cell repertoire for (A) three SR/SR patients and (B) two SR/CI patients pre-, at the peak and post/late the reinfection episode. Non-linear Gaussian regression curves were added to all graph to appreciate the deviation from the normal distribution. For patient SR/SR-1, at peak reinfection time point, the plain regression line represents the CD127- population and the dotted line represents the CD127+ population. As a reference, the normal bell shaped curve from one representative naive sample (SR/CI-2) displaying a normal distribution of CDR3 length is shown in (C).
Fig 6
Fig 6. Comparable TCR avidity for individual T cell lines isolated form SR/SR and SR/CI patients.
T cell lines were generated from patients SR/SR-1 (Cell lines R1 to R5) and SR/CI-2 (Cell lines C1 to C5) as described in Materials and Methods were stained with A2/NS3-1073 tetramer at a range of concentrations (0.02–10μg/ml, two fold dilutions). Data are expressed as mean +/- SD of duplicate samples in two independent experiments. (A) Representative FACS plot of single cell tetramer fluorescence intensity (MFI). (B-C) Tetramer titration curves. Mean fluorescence intensity (MFI, (B)) for each cell line/concentration and percentage (C) of tetramer positive cells for each cell line/concentration.
Fig 7
Fig 7. Higher functional avidity and polyfunctionality for cell lines from resolvers SR/SR compared to cell lines from chronic SR/CI.
CD8 T cell lines were stimulated with autologous BLCLs prepulsed with increasing concentrations of the cognate peptide (NS3-1073) for 6h. Surface and intracellular staining was then performed as described in Materials and Methods to examine functionality by flow cytometry. Boolean gating and analysis using SPICE software was used to assess polyfunctionality profile for each clone established from patient SR/SR-1 (Cell lines R1 to R5) or from patient SR/CI-2 (Cell lines C1 to C5). (A-D) Functionality curves for (A) CD107a, (B) TNFα, (C) IFNγ and (D) IL-2. Each point represents the percentage of positive cells following stimulation with the indicated peptide concentration. Data are expressed as mean +/- SD of duplicate samples in two independent experiments. EC50 represent the concentration of peptide needed to reach half maximal production and is shown as the average of all cell lines tested for either resolver SR/SR or chronic SR/CI cell lines. (E) Representative polyfunctionality pie charts representing the percentage of cells with no function (grey); 1 function (yellow); 2 functions (green); 3 functions (orange) and 4 functions (red). (F) Polyfunctionality index of one representative experiment in duplicate representing the degree of polyfunctionality of each cell line at each peptide concentration. Calculated as described in [31]. Statistical differences between cell lines from SR/SR and SR/CI patients were calculated by two-way Anova (* p<0.05; ** p<0.01; *** p<0.001)

Similar articles

Cited by

References

    1. Turner SJ, La Gruta NL, Kedzierska K, Thomas PG, Doherty PC. Functional implications of T cell receptor diversity. Curr Opin Immunol. 2009;21(3):286–90. Epub 2009/06/16. PubMed Central PMCID: PMCPMC2706259. 10.1016/j.coi.2009.05.004 - DOI - PMC - PubMed
    1. Blackman MA, Woodland DL. The narrowing of the CD8 T cell repertoire in old age. Curr Opin Immunol. 2011;23(4):537–42. Epub 2011/06/10. PubMed Central PMCID: PMCPMC3163762. 10.1016/j.coi.2011.05.005 - DOI - PMC - PubMed
    1. Welsh RM, Che JW, Brehm MA, Selin LK. Heterologous immunity between viruses. Immunol Rev. 2010;235(1):244–66. Epub 2010/06/12. PubMed Central PMCID: PMCPMC2917921. 10.1111/j.0105-2896.2010.00897.x - DOI - PMC - PubMed
    1. Nikolich-Zugich J, Slifka MK, Messaoudi I. The many important facets of T-cell repertoire diversity. Nat Rev Immunol. 2004;4(2):123–32. Epub 2004/03/26. 10.1038/nri1292 - DOI - PubMed
    1. Venturi V, Price DA, Douek DC, Davenport MP. The molecular basis for public T-cell responses? Nat Rev Immunol. 2008;8(3):231–8. http://www.nature.com/nri/journal/v8/n3/suppinfo/nri2260_S1.html. 10.1038/nri2260 - DOI - PubMed

Publication types

MeSH terms

Substances