

Prolonged stimulation of a brainstem raphe region attenuates experimental autoimmune encephalomyelitis
- PMID: 28147248
- PMCID: PMC5337132
- DOI: 10.1016/j.neuroscience.2017.01.037
Prolonged stimulation of a brainstem raphe region attenuates experimental autoimmune encephalomyelitis
Abstract
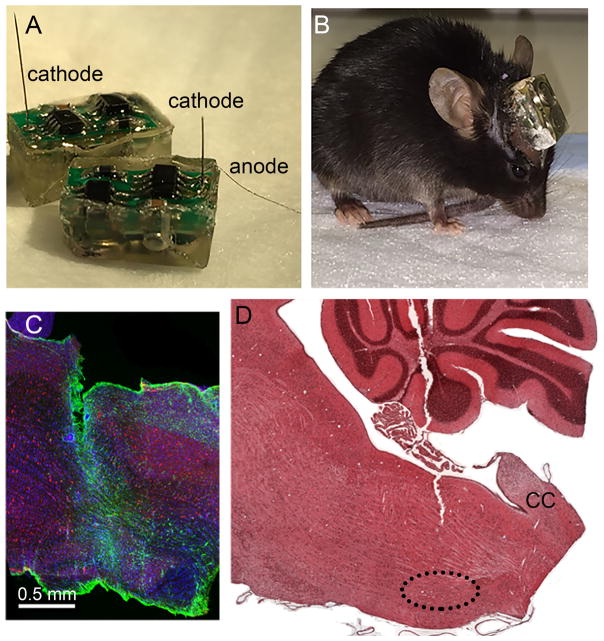
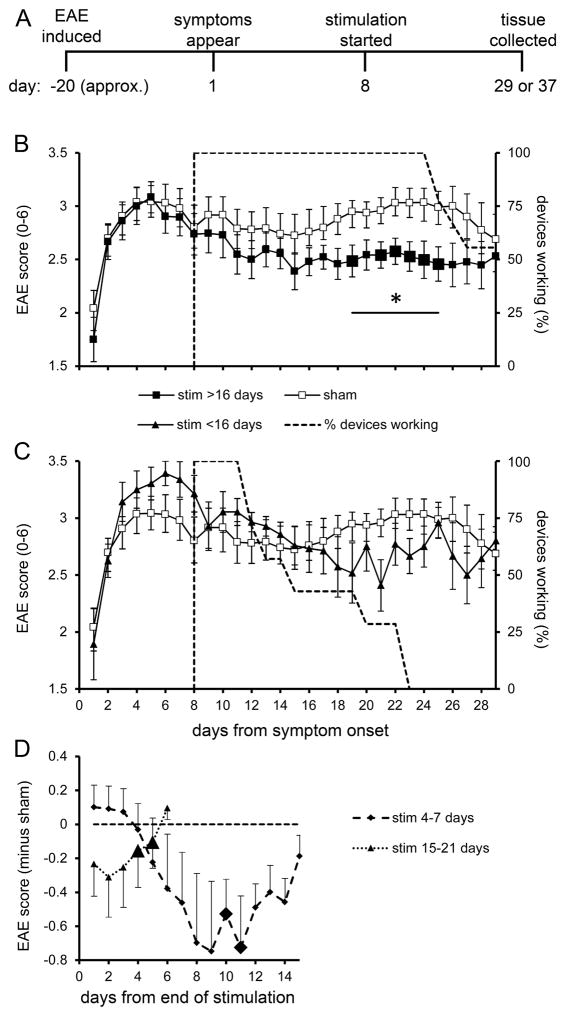
Multiple sclerosis (MS), a neuroinflammatory disease, has few treatment options, none entirely adequate. We studied whether prolonged electrical microstimulation of a hindbrain region (the nucleus raphe magnus) can attenuate experimental autoimmune encephalomyelitis, a murine model of MS induced by MOG35-55 injection. Eight days after symptoms emerged, a wireless electrical stimulator with an attached microelectrode was implanted cranially, and daily intermittent stimulation was begun in awake, unrestrained mice. The thoracic spinal cord was analyzed for changes in histology (on day 29) and gene expression (on day 37), with a focus on myelination and cytokine production. Controls, with inactive implants, showed a phase of disease exacerbation on days 19-25 that stimulation for >16days eliminated. Prolonged stimulation also reduced numbers of infiltrating immune cells and increased numbers of myelinated axons. It additionally lowered genetic expression of some pro-inflammatory cytokines (interferon gamma and tumor necrosis factor) and platelet-derived growth factor receptor alpha, a marker of oligodendrocyte precursors, while raising expression of myelin basic protein. Studies of restorative treatments for MS might profitably consider ways to stimulate the raphe magnus, directly or via its inputs, or to emulate its serotonergic and peptidergic output.
Keywords: cytokines; deep brain stimulation; multiple sclerosis; myelination; nucleus raphe magnus.
Copyright © 2017 IBRO. Published by Elsevier Ltd. All rights reserved.
Figures


Similar articles
-
Inhibition of soluble tumour necrosis factor is therapeutic in experimental autoimmune encephalomyelitis and promotes axon preservation and remyelination.Brain. 2011 Sep;134(Pt 9):2736-54. doi: 10.1093/brain/awr199. Brain. 2011. PMID: 21908877 Free PMC article.
-
Nobiletin attenuates inflammation via modulating proinflammatory and antiinflammatory cytokine expressions in an autoimmune encephalomyelitis mouse model.Fitoterapia. 2022 Jan;156:105099. doi: 10.1016/j.fitote.2021.105099. Epub 2021 Dec 9. Fitoterapia. 2022. PMID: 34896483
-
Promotion of recovery from thoracic spinal cord contusion in rats by stimulation of medullary raphe or its midbrain input.Neurorehabil Neural Repair. 2012 May;26(4):374-84. doi: 10.1177/1545968311425178. Epub 2011 Dec 19. Neurorehabil Neural Repair. 2012. PMID: 22183979
-
Interferon regulatory factor 1 regulation of oligodendrocyte injury and inflammatory demyelination.Rev Neurosci. 2012 Jan 26;23(2):145-52. doi: 10.1515/revneuro-2011-068. Rev Neurosci. 2012. PMID: 22499673 Review.
-
Nudging oligodendrocyte intrinsic signaling to remyelinate and repair: Estrogen receptor ligand effects.J Steroid Biochem Mol Biol. 2016 Jun;160:43-52. doi: 10.1016/j.jsbmb.2016.01.006. Epub 2016 Jan 14. J Steroid Biochem Mol Biol. 2016. PMID: 26776441 Free PMC article. Review.
Cited by
-
Cellular Changes in Injured Rat Spinal Cord Following Electrical Brainstem Stimulation.Brain Sci. 2019 May 28;9(6):124. doi: 10.3390/brainsci9060124. Brain Sci. 2019. PMID: 31142050 Free PMC article.
-
Oligodendrocytes modulate the immune-inflammatory response in EAE via TNFR2 signaling.Brain Behav Immun. 2020 Feb;84:132-146. doi: 10.1016/j.bbi.2019.11.017. Epub 2019 Nov 27. Brain Behav Immun. 2020. PMID: 31785393 Free PMC article.
-
Some Autonomic Deficits of Acute or Chronic Cervical Spinal Contusion Reversed by Interim Brainstem Stimulation.J Neurotrauma. 2018 Feb 1;35(3):560-572. doi: 10.1089/neu.2017.5123. Epub 2017 Dec 21. J Neurotrauma. 2018. PMID: 29160143 Free PMC article.
-
A novel wireless brain stimulation device for long-term use in freely moving mice.Sci Rep. 2019 Apr 23;9(1):6444. doi: 10.1038/s41598-019-42910-7. Sci Rep. 2019. PMID: 31015544 Free PMC article.
-
Brainstem-Evoked Transcription of Defensive Genes After Spinal Cord Injury.Front Cell Neurosci. 2019 Nov 19;13:510. doi: 10.3389/fncel.2019.00510. eCollection 2019. Front Cell Neurosci. 2019. PMID: 31803022 Free PMC article.
References
Publication types
MeSH terms
Substances
Grants and funding
LinkOut - more resources
Full Text Sources
Other Literature Sources
Medical
