. 2017 Jan 31;18(5):1157-1170.
doi: 10.1016/j.celrep.2016.12.089.

Neuregulin 3 Mediates Cortical Plate Invasion and Laminar Allocation of GABAergic Interneurons

Affiliations

Neuregulin 3 Mediates Cortical Plate Invasion and Laminar Allocation of GABAergic Interneurons

Giorgia Bartolini et al. Cell Rep. .

Abstract

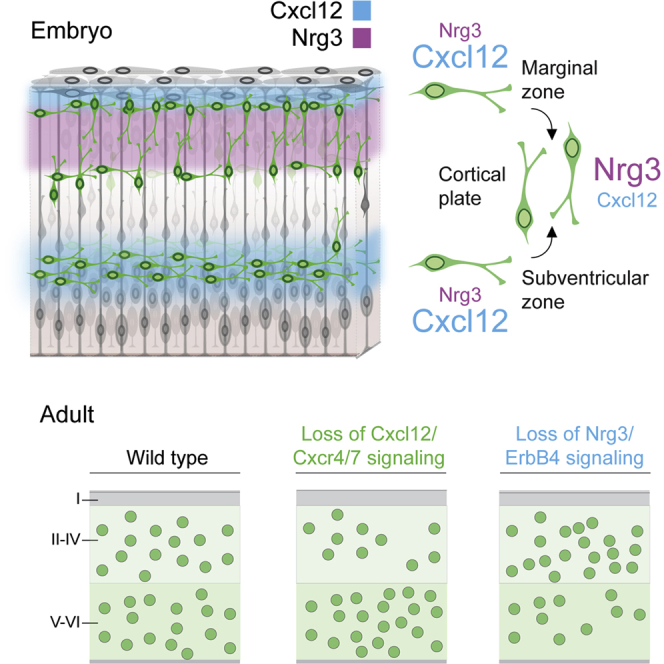
Neural circuits in the cerebral cortex consist of excitatory pyramidal cells and inhibitory interneurons. These two main classes of cortical neurons follow largely different genetic programs, yet they assemble into highly specialized circuits during development following a very precise choreography. Previous studies have shown that signals produced by pyramidal cells influence the migration of cortical interneurons, but the molecular nature of these factors has remained elusive. Here, we identified Neuregulin 3 (Nrg3) as a chemoattractive factor expressed by developing pyramidal cells that guides the allocation of cortical interneurons in the developing cortical plate. Gain- and loss-of-function approaches reveal that Nrg3 modulates the migration of interneurons into the cortical plate in a process that is dependent on the tyrosine kinase receptor ErbB4. Perturbation of Nrg3 signaling in conditional mutants leads to abnormal lamination of cortical interneurons. Nrg3 is therefore a critical mediator in the assembly of cortical inhibitory circuits.

Keywords: Erbb4; GABA; cerebral cortex; cortical plate; inhibition; interneuron; lamination; migration; neuregulins; pyramidal cell.


Figures

None
Graphical abstract
Figure 1
Figure 1
Identification of Factors Regulating the Invasion of the Cortical Plate by Interneurons (A) Schematic of the experimental design. A plasmid encoding Gfp was electroporated in the neocortex of E14.5 mouse embryos. The electroporated region was then isolated at E17.5 or P4, and GFP+ cells were dissociated and recovered via FACS. (B and C) Distribution of GFP+ pyramidal cells at E17.5 (B) and P4 (C), prior to isolation. (D) FACS of GFP+ cells. (E) Among the pool of candidate genes (Table S1), we found 42 that were differentially expressed between the two stages. The corresponding p values from t-tests are shown in Table S2. Histograms show average ± SEM. Scale bar represents 250 μm.
Figure 2
Figure 2
Expression of Nrg3 mRNA in the Developing Mouse Cortex (A–E′) Coronal sections through the telencephalon of E13.5 (A and A′), E15.5 (B and B′), E18.5 (C and C′), P2 (D and D′), and P4 (E and E′) embryos and neonates showing mRNA expression for Nrg3. Ac, anterior commissure; CP, cortical plate; H, Hippocampus; ic, internal capsule; LGE, lateral ganglionic eminence; MGE, medial ganglionic eminence; MZ, marginal zone; NCx, neocortex; PCx, piriform cortex; Str, striatum; SVZ, subventricular zone; Th, thalamus; VZ, ventricular zone; I–VI, cortical layers I–VI. Scale bars represent 250 μm.
Figure 3
Figure 3
Nrg3 Functions as a Short-Range Chemoattractant for MGE-Derived Interneurons and Requires ErbB4 Receptors (A) Schematic of the experimental design. MGE explants were confronted to transfected COS cells located at relative long (A1) or short (A2) distances. (B–G) Migration of MGE-derived interneurons in response to mock- (B and E), Ig-Nrg1- (C), CRD-Nrg1- (D), or Nrg3-transfected (D and G) COS cells located at relatively long (B–D) and short (E–G) range. Dotted lines indicate the limits of the explants and COS cell aggregates. (H) Quantification of long-distance confrontation assays. Control: MGE versus mock, n = 19; MGE versus Ig-Nrg1, n = 24; one-way ANOVA, ∗∗p < 0.01. MGE versus Nrg3, n = 20; one-way ANOVA, p > 0.05. (I) Quantification of short-distance confrontation assays. Control: MGE versus mock, n = 29; MGE versus CRD-Nrg1, n = 24, MGE versus Nrg3, n = 27; one-way ANOVA, ∗∗p < 0.01. (J) Schematic of the experimental design. MGE explants were confronted to control and Nrg3-transfected COS cells located at relative short distances. (K, L, N, and O) Migration of MGE-derived cells derived from Erbb4+/+;HER4heart (K and L) and Erbb4−/−;HER4heart (N and O) mice in response to mock- (K and N) or Nrg3-transfected (L and O) COS cell aggregates cultured in matrigel matrices for 48 hr. (M) Quantification of confrontation assays. Erbb4+/+;HER4heart versus mock, n = 33; Erbb4+/+;HER4heart versus Nrg3, n = 25; Erbb4−/−;HER4heart versus mock, n = 15; Erbb4−/−;HER4heart versus Nrg3, n = 14; one-way ANOVA, ∗∗∗p < 0.001. Histograms show average ± SEM. NCx, neocortex; MGE, medial ganglionic eminence. Scale bar represents 200 μm.
Figure 4
Figure 4
MGE-Derived Interneurons Display Preferential Responses to Cxcl12 and Nrg3 (A) Schematic of the experimental designs. MGE explants were confronted to transfected COS cells located at relative short distances (A1) or placed on coated matrices in stripe choice assays (A2). (B–D) Migration of MGE-derived interneurons in response to mock- (B), Nrg3- (C), or Nrg3- and Cxcl12-transfected (D) COS cells. Dotted lines indicate the limits of the explants and COS cell aggregates. (E) Quantification of MGE-derived interneurons migrating away from explants. MGE versus mock, n = 18; MGE versus Nrg3, n = 15; MGE versus Nrg3 + Cxcl12, n = 27; one-way ANOVA, ∗∗∗p < 0.001. (F) Quantification of short-distance confrontation assays. MGE versus mock, n = 18; MGE versus Nrg3, n = 15; MGE versus Nrg3 + Cxcl12, n = 27; one-way ANOVA, ∗∗∗p < 0.001, p < 0.05. (G and H) Migration of MGE-derived cells in the stripe choice assay, with control and Nrg3-coated (G) or Nrg3- and Cxcl12-coated alternating stripes (H). (I) Quantification of stripe choice assays. Nrg3/Nrg3 (n = 11) versus Nrg3/GST (n = 20); one-way ANOVA, ∗∗∗p < 0.001. Cxl12/Cxl12 (n = 13) versus Nrg3/Cxcl12 (n = 18); one-way ANOVA, ∗∗∗p < 0.001. Histograms show average ± SEM. NCx, neocortex; MGE, medial ganglionic eminence. Scale bar represents 200 μm.
Figure 5
Figure 5
Nrg3 Overexpression in Pyramidal Cells Enhances Interneuron Invasion of the CP In Vivo (A) Schematic of the experimental design. The pallial ventricular zone of Nkx2-1Cre;Ai9 embryos was electroporated at E14.5 with Gfp-expressing or Gfp- and Nrg3-expressing plasmids, and the distribution of MGE-derived interneurons was analyzed at E18.5. (B, C, E, and F) Distribution of MGE-derived interneurons (labeled with tdTomato) in the somatosensory cortex of E18.5 Nkx2-1Cre;Ai9 embryos following in utero electroporation of Gfp (B and C) or Gfp and Nrg3 (E and F) at E14.5. (D) Density of MGE-derived cells in the CP; n = 6; t test, ∗∗∗p < 0.001. Histograms show average ± SEM. CP, cortical plate; MZ, marginal zone; V and VI, cortical layers V and VI, respectively. Scale bar represents 200 μm.
Figure 6
Figure 6
Abnormal Lamination of Cortical Interneurons in Conditional Nrg3 Mutants (A and B) Distribution of Erbb4-expressing interneurons in the somatosensory cortex of control (A) and conditional Nrg3 (B) mice at P30. (C) Quantification of the distribution of Erbb4-expressing cells; n = 4; χ2 test, p < 0.05. (D and E) Distribution of PV+ interneurons in the somatosensory cortex of control (D) and conditional Nrg3 (E) mice at P30. (F) Quantification of the distribution of PV+ interneurons; n = 5; χ2 test, p < 0.05. (G and H) Distribution of Lhx6-expressing cells in the somatosensory cortex of control (G) and conditional Nrg3 (H) mice at P4. (I) Quantification of the laminar distribution of Lhx6-expressing cells; n = 5; p < 0.05, χ2 test. Histograms show average ± SEM. Scale bars represent 200 μm.
Figure 7
Figure 7
Abnormal Lamination of Cortical Interneurons in Conditional Erbb4 Mutants (A) Schematic of the experimental design. (B–E) Laminar distribution of PV+ interneurons (red) and specific cohorts of PV+ interneurons labeled after BrdU injections at E12.5 (B and C) and E15.5 (D and E) (red and green) in the somatosensory cortex of control (B and D) and conditional Erbb4 mutant (C and E) mice at P30. (F) Quantification of the distribution of PV+ interneurons; n = 5; χ2 test, p < 0.05. (G and H) Quantification of the distribution of specific cohorts of PV+ interneurons born at E12.5 (G) and E15.5 (H); n = 5; χ2 test, p < 0.05. Histograms show average ± SEM. Scale bar represents 200 μm.

References

    1. Abe P., Mueller W., Schütz D., MacKay F., Thelen M., Zhang P., Stumm R. CXCR7 prevents excessive CXCL12-mediated downregulation of CXCR4 in migrating cortical interneurons. Development. 2014;141:1857–1863. - PubMed
    1. Abe P., Molnár Z., Tzeng Y.S., Lai D.M., Arnold S.J., Stumm R. Intermediate progenitors facilitate intracortical progression of thalamocortical axons and interneurons through CXCL12 chemokine signaling. J. Neurosci. 2015;35:13053–13063. - PMC - PubMed
    1. Anderson S.A., Eisenstat D.D., Shi L., Rubenstein J.L.R. Interneuron migration from basal forebrain to neocortex: dependence on Dlx genes. Science. 1997;278:474–476. - PubMed
    1. Aron A.R., Poldrack R.A. The cognitive neuroscience of response inhibition: relevance for genetic research in attention-deficit/hyperactivity disorder. Biol. Psychiatry. 2005;57:1285–1292. - PubMed
    1. Baudoin J.P., Viou L., Launay P.S., Luccardini C., Espeso Gil S., Kiyasova V., Irinopoulou T., Alvarez C., Rio J.P., Boudier T. Tangentially migrating neurons assemble a primary cilium that promotes their reorientation to the cortical plate. Neuron. 2012;76:1108–1122. - PubMed

MeSH terms

Substances

LinkOut - more resources