. 2017 Feb 28;8(9):15168-15181.
doi: 10.18632/oncotarget.14834.

Colorectal cancer cells suppress CD4+ T cells immunity through canonical Wnt signaling

Affiliations

Colorectal cancer cells suppress CD4+ T cells immunity through canonical Wnt signaling

Xuan Sun et al. Oncotarget. .

Abstract

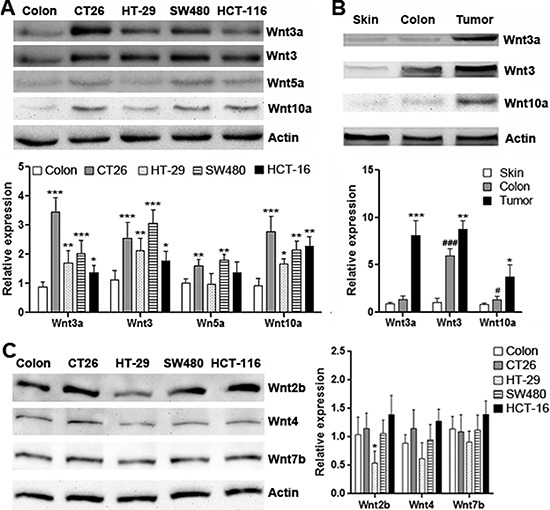
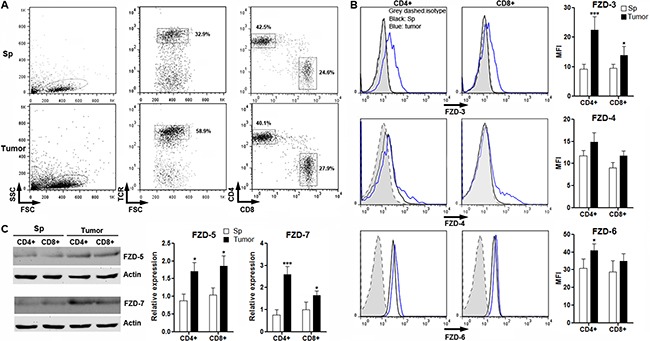
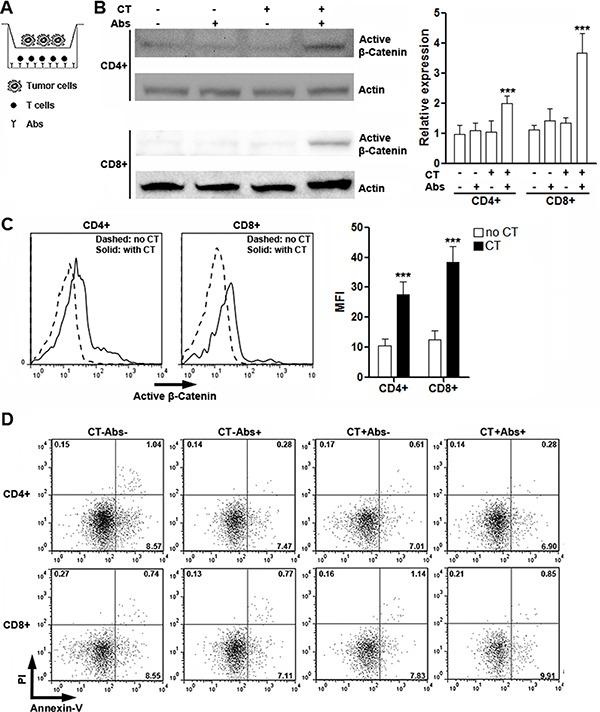
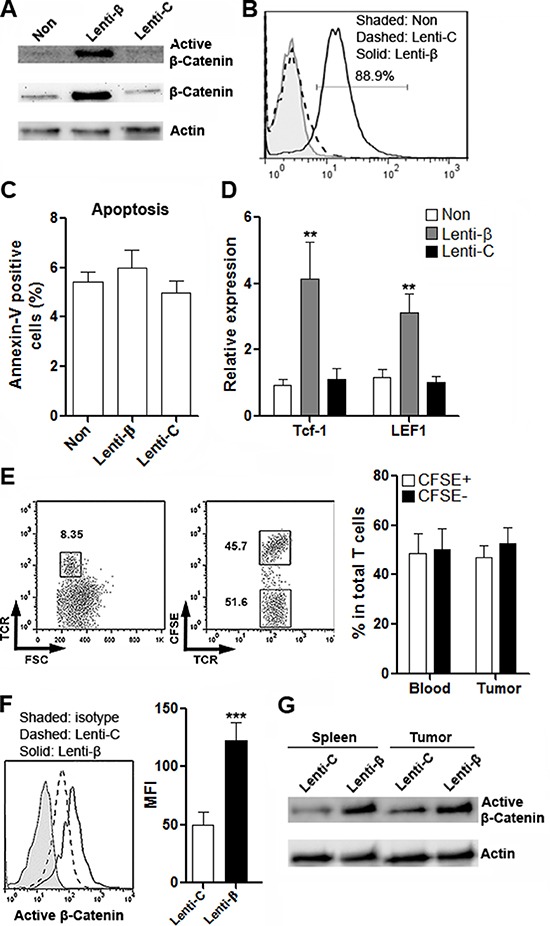
Understanding how colorectal cancer escapes from immunosurveillance and immune attack is important for developing novel immunotherapies for colorectal cancer. In this study we evaluated the role of canonical Wnt signaling in the regulation of T cell function in a mouse colorectal cancer model. We found that colorectal cancer cells expressed abundant Wnt ligands, and intratumoral T cells expressed various Frizzled proteins. Meanwhile, both active β-catenin and total β-catenin were elevated in intratumoral T cells. In vitro study indicated that colorectal cancer cells suppressed IFN-γ expression and increased IL-17a expression in activated CD4+ T cells. However, the cytotoxic activity of CD8+ T cells was not altered by colorectal cancer cells. To further evaluate the importance of Wnt signaling for CD4+ T cell-mediated cancer immunity, β-catenin expression was enforced in CD4+ T cells using lentiviral transduction. In an adoptive transfer model, enforced expression of β-catenin in intratumoral CD4+ T cells increased IL-17a expression, enhanced proliferation and inhibited apoptosis of colorectal cancer cells. Taken together, our study disclosed a new mechanism by which colorectal cancer impairs T cell immunity.

Keywords: CD4+ T cells immunity; canonical Wnt signaling; colorectal cancer; negatively regulate.


Conflict of interest statement

CONFLICTS OF INTEREST

The authors declare no conflicts of interest.

Figures

Figure 1
Figure 1. Expression of Wnt proteins in CRC cell lines
(A) Expression of Wnt3a, Wnt3, Wnt5a and Wnt10a in mouse and human CRC cell lines. Upper panel: representative Western blot images. Lower panel: statistical analysis for expression of each Wnt protein. N = 6 per group. *p < 0.05; **p < 0.01; ***p < 0.001 compared with normal colon tissue. (B) Expression of Wnt3a, Wnt3 and Wnt10a in normal tissues and CT26.CL25 tumor grafts. Upper panel: representative Western blot images. Lower panel: Statistical analysis for expression of each Wnt protein. Skin: normal skin tissue. Colon: normal colon tissue. Tumor: tumor grafts. N = 4 per group. *p < 0.05; **p < 0.01; ***p < 0.001 compared with normal colon tissue. ###p < 0.05; ###p < 0.001 compared with normal skin tissue. (C) Expression of Wnt2b, Wnt4 and Wnt7b. Left panel: representative Western blot images. Right panel: Statistical analysis for expression of each Wnt protein. N = 3 per group. *p < 0.05 compared with normal colon tissue.
Figure 2
Figure 2. Expression of FZD protein in intratumoral T cells
(A) Gating strategy for splenic and intratumoral CD4+ and CD8+ T cells. Numbers in the plots are the percentages of gated populations. Sp: spleen. Tumor: tumor grafts. This is a representative of three independent experiments. (B) Expression of FZD-3, FZD-4 and FZD-6 on T cells were determined by flow cytometry. Left panel: representative histograms. Right panel: statistical analysis for mean fluorescence intensity of each FZD protein. (C) Expression of FZD-5 and FZD-7 in T cells were determined by Western blot. Left panel: representative image. Right panel: statistical analysis for each FZD protein. Sp: spleen. Tumor: tumor grafts. N = 3 per group. *p < 0.05; ***p < 0.001 compared with splenic T cell subsets.
Figure 3
Figure 3. Expression of active β-catenin and total β-catenin in intratumoral T cells
(A and B) Expression of active β-catenin and total β-catenin in splenic and intratumoral CD4+ (A) and CD8+ (B) T cells were determined by Western blot. Left panels: representative Western blot images. Right panels: statistical analysis. (C) Expression of active β-catenin in splenic and intratumoral CD4+ and CD8+ T cells were determined by flow cytometry. Left panel: representative histograms. Right panel: statistical analysis for mean fluorescence intensity of active β-catenin. Sp: spleen. Tumor: tumor grafts. N = 3 per group. *p < 0.05; **p < 0.01; ***p < 0.001 compared with splenic T cell counterparts.
Figure 4
Figure 4. CT26.CL25 cells induce activation of β-catenin in activated T cells
(A) Illustration of co-culture system. (B) Expression of active β-catenin in cultured splenic CD4+ and CD8+ T cells was determined by Western blot. Left panels: representative Western blot images. Right panels: statistical analysis for active β-catenin. CT: CT26.CL25 cells. Abs: agonistic antibodies. N = 6 per group. ***p < 0.001 compared with T cell culture without CT26.CL25 cells and agonistic antibodies. (C) Expression of active β-catenin in activated splenic CD4+ and CD8+ T cells was determined by flow cytometry. Note that T cells shown here are all stimulated with agonistic antibodies. Left panel: representative histograms. Right panel: statistical analysis. No CT: without CT26.CL25 cells. CT: co-culture with CT26.CL25 cells. N = 6 per group. ***p < 0.001 compared with “No CT” group. (D) Flow cytometry analysis of T cell apoptosis in culture. Numbers in the quadrants are percentages of corresponding gated populations. This is a representative of two independent experiments.
Figure 5
Figure 5. CT26.CL25 cells bias CD4+ T cell polarization towards Th17 via Wnt signaling
(A and B) Expression of cytokines (A) and master regulators (B) in cultured CD4+ T cells were determined by real-time PCR. Ctrl: untreated T cells. CT: T cells co-cultured with CT26.CL25 cells. Abs: agonistic antibody-stimulated T cells. Abs+CT: agonistic antibody-stimulated T cells co-cultured with CT26.CL25 cells. (C) Expression of cytotoxic mediators in cultured CD8+ T cells were determined by real-time PCR. (D) Expression of cytokines and master regulators in cultured CD4+ T cells were determined by real-time PCR. Abs: agonistic antibody-stimulated T cells. Abs+DKK1: agonistic antibody-stimulated T cells in the presence of DKK1. Abs+CT: agonistic antibody-stimulated T cells co-cultured with CT26.CL25 cells. Abs+CT+DKK1: agonistic antibody-stimulated T cells co-cultured with CT26.CL25 cells and DKK1. (E) Expression of IFN-γ and IL-17a were measured by flow cytometry analysis. Numbers in the plots are percentages of gated populations. (F) CFSE dilution in proliferative CD4+ T cells. N = 6 per group. For A to C, *p < 0.05; **p < 0.01; ***p < 0.001 compared with Ctrl group. #p < 0.05; ##p < 0.01 compared with Abs group. For D, *p < 0.05; **p < 0.01; ***p < 0.001 compared with Abs group. #p < 0.05 compared with Abs+CT group.
Figure 6
Figure 6. Enforced expression of β-catenin in CD4+ T cells through lentiviral transduction
(A) Expression of active β-catenin and total β-catenin in CD4+ T cells after lentiviral transduction was determined by Western blot. This is a representative of two independent experiments. Non: non-transduced T cells. Lenti-β: T cells transduced with β-catenin Lentiviral Activation Particles. Lenti-C: T cells transduced with control lentiviral particles. (B) Expression of active β-catenin in T cells was detected by flow cytometry. This is a representative of two independent experiments. (C) T cells apoptosis after lentiviral transduction. N = 4 per group. (D) Expression of Tcf-1 and LEF1 in T cells were evaluated by real-time PCR after lentiviral transduction. N = 6 per group. **p < 0.01 compared with “Non” group. (E) Proportions of CFSE- and CFSE+ T cells in tumor grafts were evaluated by flow cytometry. Left panel: representative dot plots. Right panel: statistics. Numbers in the plots are proportions of corresponding gated populations. N = 3 per group. (F) Expression of active β-catenin in donor-derived intratumoral T cells was determined by flow cytometry. Left panel: representative histograms. Right panel: statistics of MFI. N = 3 per group. ***p < 0.001. (G) Expression of active β-catenin in donor-derived splenic and intratumoral T cells was determined by Western blot. This is a representative of two independent experiments.
Figure 7
Figure 7. Enforced expression of β-catenin in CD4+ T cells favors growth of CRC grafts
(A and B) Expression of cytokines (A) and master regulators (B) in donor-derived intratumoral CD4+ T cells were assessed by real-time PCR. Lenti-β: T cells transduced with β-catenin Lentiviral Activation Particles. Lenti-C: T cells transduced with control lentiviral particles. N = 6 per group. **p < 0.01; ***p < 0.001 compared with Lenti-C group. (C) Expression of indicated cytokines in CRC grafts. Ctrl: mice receiving PBS. Lenti-C: mice receiving T cells transduced with control lentiviral particles. Lenti-β: mice receiving T cells transduced with β-catenin Lentiviral Activation Particles. N = 6 per group. *p < 0.05 compared with Lenti-C group. (D) Gating strategy for CT26.CL25 cell detection in CRC grafts. (E and F) Proliferation of implanted CT26.CL25 cells. Histograms of Ki67 staining were shown in (E), and statistics was shown in (F). N = 6 per group. (G and H) Apoptosis of implanted CT26.CL25 cells was measured by flow cytometry. Representative dot plots of Annexin V staining were shown in (G), and statistics was shown in (H). N=6 per group. (I) Tumor volume after adoptive transfer. N = 10 per group. For F, H and I, ***p < 0.001 compared with Ctrl group. #p < 0.05, ##p < 0.01 compared with Lenti-C group.

Similar articles

Cited by

References

    1. Deschoolmeester V, Baay M, Lardon F, Pauwels P, Peeters M. Immune Cells in Colorectal Cancer: Prognostic Relevance and Role of MSI. Cancer Microenviron. 2011;4:377–392. - PMC - PubMed
    1. Jacobs J, Smits E, Lardon F, Pauwels P, Deschoolmeester V. Immune Checkpoint Modulation in. Colorectal Cancer: What's New and What to Expect. J Immunol Res. 2015;2015:158038. - PMC - PubMed
    1. Pancione M, Giordano G, Remo A, Febbraro A, Sabatino L, Manfrin E, Ceccarelli M, Colantuoni V. Immune escape mechanisms in colorectal cancer pathogenesis and liver metastasis. J Immunol Res. 2014;2014:686879. - PMC - PubMed
    1. Prall F, Duhrkop T, Weirich V, Ostwald C, Lenz P, Nizze H, Barten M. Prognostic role of CD8+ tumor-infiltrating lymphocytes in stage III colorectal cancer with and without microsatellite instability. Hum Pathol. 2004;35:808–816. - PubMed
    1. Koch M, Beckhove P, J Op den Winkel, Autenrieth D, Wagner P, Nummer D, Specht S, Antolovic D, Galindo L, Schmitz-Winnenthal FH, Schirrmacher V, Buchler MW, Weitz J. Tumor infiltrating T lymphocytes in colorectal cancer: Tumor-selective activation and cytotoxic activity in situ. Ann Surg. 2006;244:986–992. discussion 992–983. - PMC - PubMed

MeSH terms