. 2017 Jan;141(1):324.
doi: 10.1121/1.4973912.

Notched-noise precursors improve detection of low-frequency amplitude modulation

Affiliations

Notched-noise precursors improve detection of low-frequency amplitude modulation

Ali Almishaal et al. J Acoust Soc Am. 2017 Jan.

Abstract

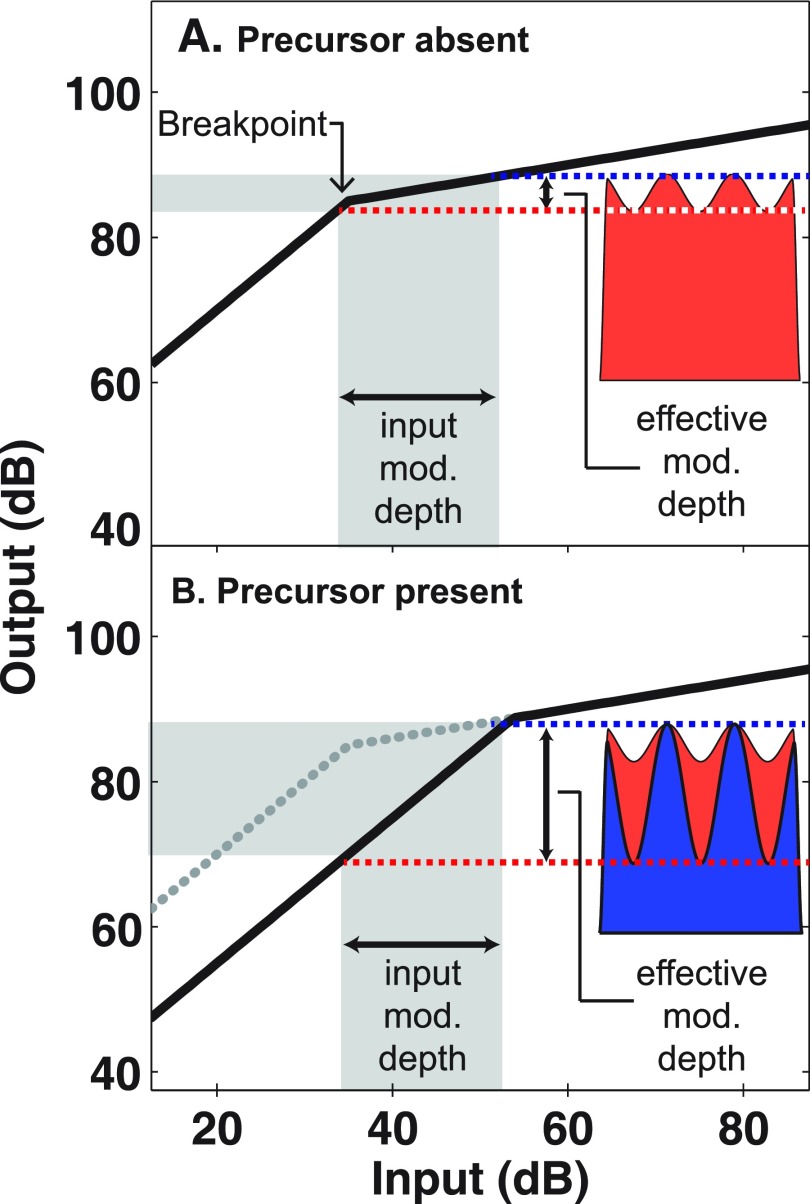
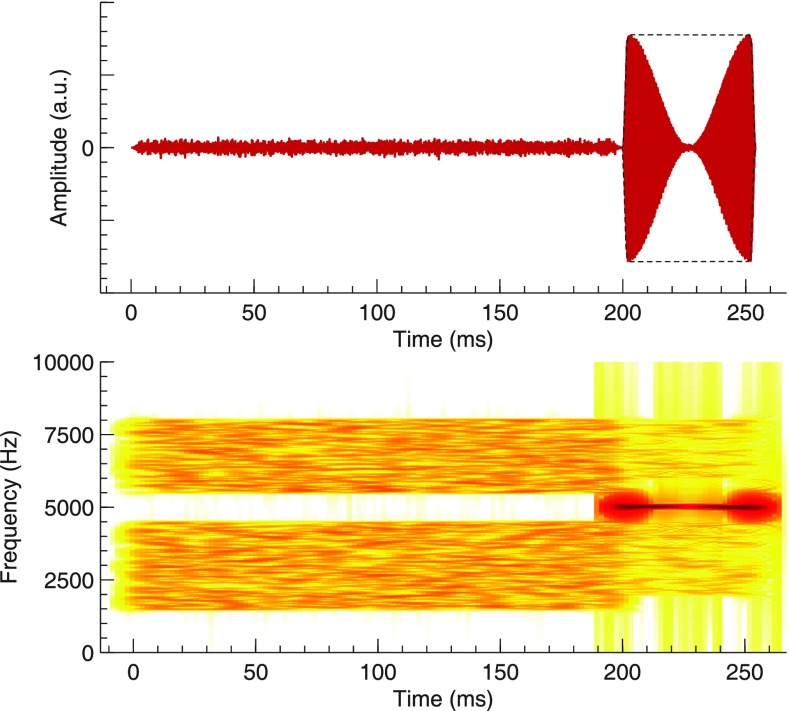
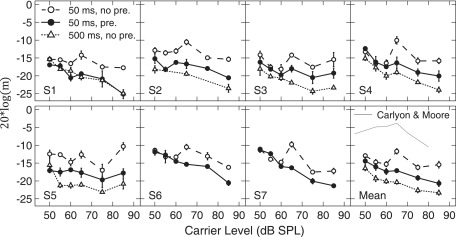
Amplitude modulation (AM) detection was measured with a short (50 ms), high-frequency carrier as a function of carrier level (Experiment I) and modulation frequency (Experiment II) for conditions with or without a notched-noise precursor. A longer carrier (500 ms) was also included in Experiment I. When the carrier was preceded by silence (no precursor condition) AM detection thresholds worsened for moderate-level carriers compared to lower- or higher-level carriers, resulting in a "mid-level hump." AM detection thresholds with a precursor were better than those without a precursor, primarily for moderate-to-high level carriers, thus eliminating the mid-level hump in AM detection. When the carrier was 500 ms, AM thresholds improved by a constant (across all levels) relative to AM thresholds with a precursor, consistent with the longer carrier providing more "looks" to detect the AM signal. Experiment II revealed that improved AM detection with compared to without a precursor is limited to low-modulation frequencies (<60 Hz). These results are consistent with (1) a reduction in cochlear gain over the course of the precursor perhaps via the medial olivocochlear reflex or (2) a form of perceptual enhancement which may be mediated by adaptation of inhibition.


Figures

FIG. 1.
FIG. 1.
(Color online) Schematic of the expected effects of a reduction in cochlear gain on effective modulation depth. Cochlear response growth through an auditory filter centered on the carrier frequency grows linearly at low carrier levels, and compressively at mid-to-high carrier levels (solid line), where linear and compressive regions intersect at a breakpoint. The presentation of a precursor is assumed to reduce cochlear gain, resulting in a rightward shift in the compression breakpoint. For moderate-level carriers preceded by silence [(A) precursor absent] or by a precursor [(B) precursor present] the effective modulation depth is smaller or roughly equal to the input modulation depth, respectively. The solid line in (A) is replotted in (B) as a gray dotted line. Horizontal double arrows show the input modulation depth. Horizontal dash lines and vertical double arrows show the effective modulation depth.
FIG. 2.
FIG. 2.
(Color online) Time waveform (top) and spectrogram (bottom) of the 200-ms, notched-noise precursor, followed by the 50-ms (plus 2-ms rise/fall ramps) narrowband, amplitude-modulated carrier. The dashed line in the top panel shows the envelope of the unmodulated carrier. Off-frequency listening was limited by gating an additional notched noise with the carrier. For the spectrogram, dark colors represent relatively higher amplitudes, while light colors represent relatively lower amplitudes. (a.u.: arbitrary units.)
FIG. 3.
FIG. 3.
Modulation depth at threshold as a function of carrier level for short (open circles) and long (open triangles) carriers preceded by silence, or for short carriers preceded by a notched-noise precursor (closed circles). Lower values represent better AM detection [i.e., lower modulation depth (m) at threshold]. Panels are results for individual subjects except the lower right panel, which displays the mean data. The modulation frequency was 20 Hz. Mean data from Carlyon and Moore (1984) are shown by the gray line in the lower right panel to illustrate the mid-level hump observed in some intensity discrimination experiments. Error bars are the standard error of the mean.
FIG. 4.
FIG. 4.
Modulation depth at threshold as a function of modulation frequency for 65 dB SPL carriers preceded by silence (open circles) or by a notched-noise precursor (closed circles). Panels are results for individual subjects except the lower right panel, which displays the mean data. Mean data from Exp. I (black and gray asterisks), where fm = 20 Hz are replotted in the lower right panel to show consistency between measurements. Error bars are the standard error of the mean.

References

    1. Backus, B. C. , and Guinan, J. J. (2006). “ Time-course of the human medial olivocochlear reflex,” J. Acoust. Soc. Am. 119, 2889–2904.10.1121/1.2169918 - DOI - PubMed
    1. Bacon, S. P. , and Savel, S. (2004). “ Temporal effects in simultaneous masking with on- and off-frequency noise maskers: Effects of signal frequency and masker level,” J. Acoust. Soc. Am. 115, 1674–1683.10.1121/1.1689344 - DOI - PubMed
    1. Bidelman, G. M. , Jennings, S. G. , and Strickland, E. A. (2015). “ PsyAcoustX: A flexible MATLAB® package for psychoacoustics research,” Front. Psychol. 6, 1498.10.3389/fpsyg.2015.01498 - DOI - PMC - PubMed
    1. Brown, M. C. (2014). “ Single-unit labeling of medial olivocochlear neurons: The cochlear frequency map for efferent axons,” J. Neurophysiol. 111, 2177–2186.10.1152/jn.00045.2014 - DOI - PMC - PubMed
    1. Brown, M. C. (2016). “ Recording and labeling at a site along the cochlea shows alignment of medial olivocochlear and auditory nerve tonotopic mappings,” J. Neurophys. 115, 1644–1653.10.1152/jn.00842.2015 - DOI - PMC - PubMed

Publication types

LinkOut - more resources