. 2017 Jan;141(1):81.
doi: 10.1121/1.4973620.

Use of a glimpsing model to understand the performance of listeners with and without hearing loss in spatialized speech mixtures

Affiliations

Use of a glimpsing model to understand the performance of listeners with and without hearing loss in spatialized speech mixtures

Virginia Best et al. J Acoust Soc Am. 2017 Jan.

Abstract

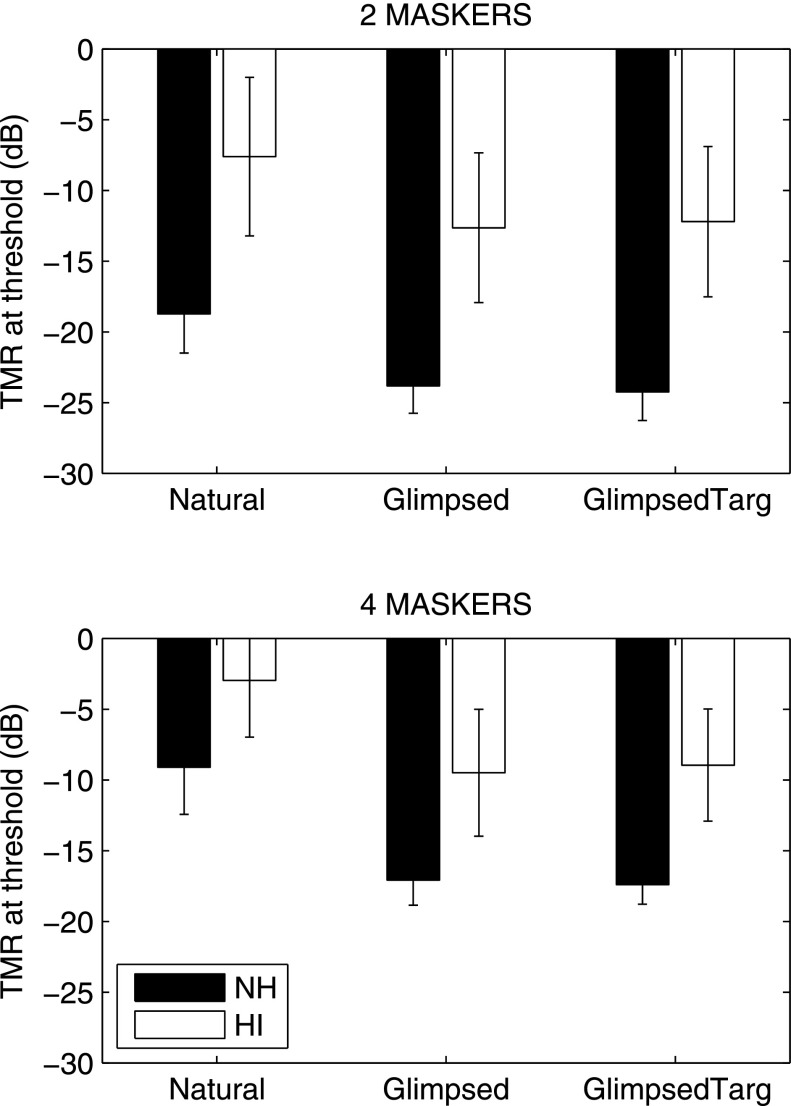
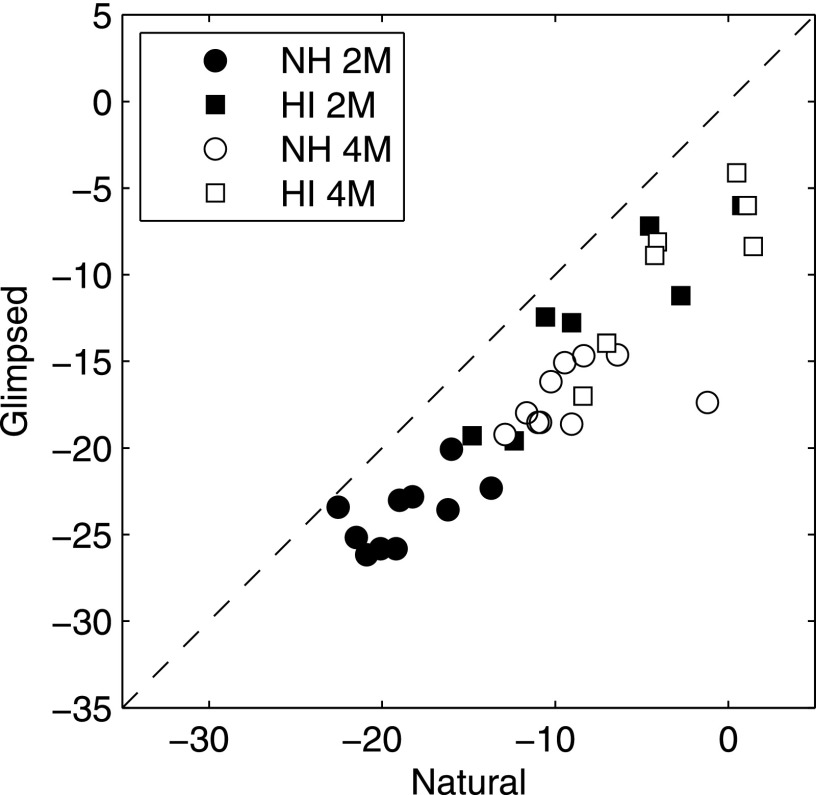
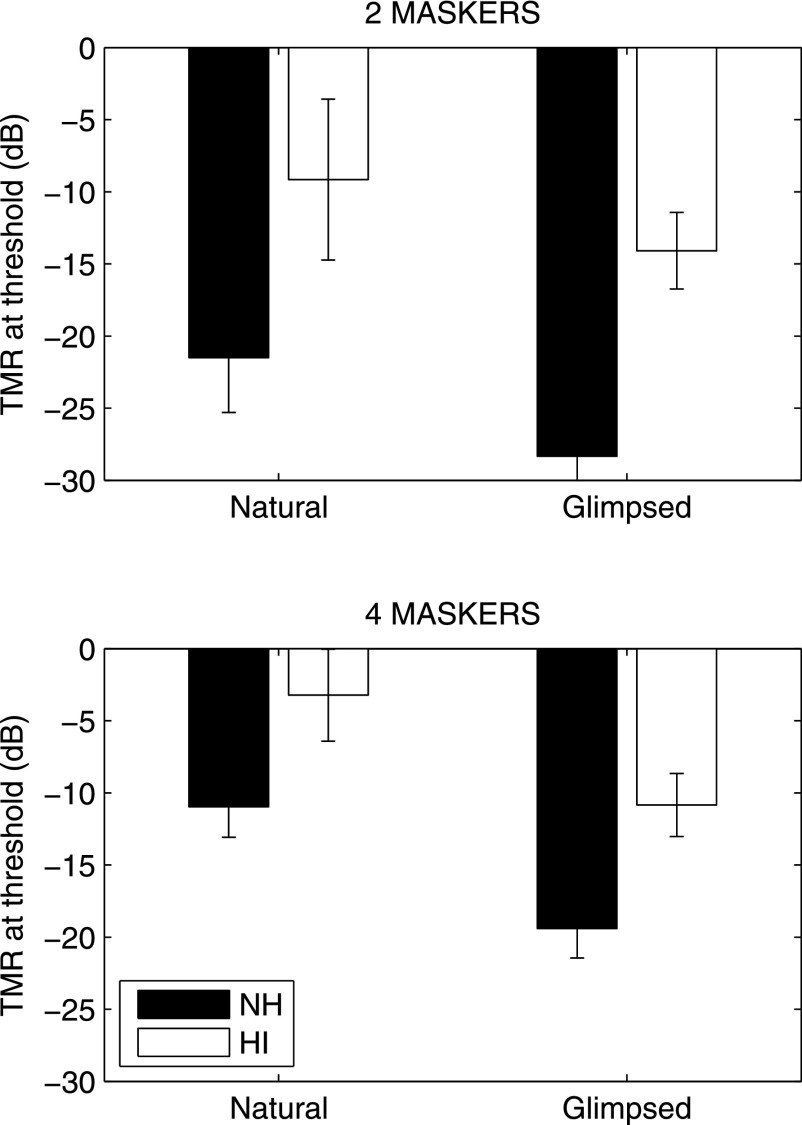
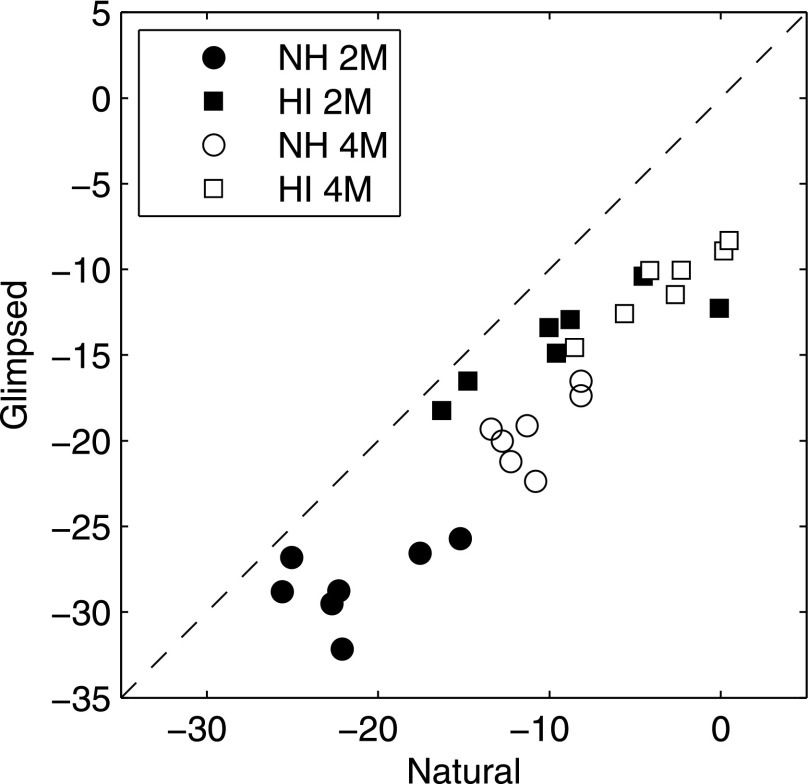
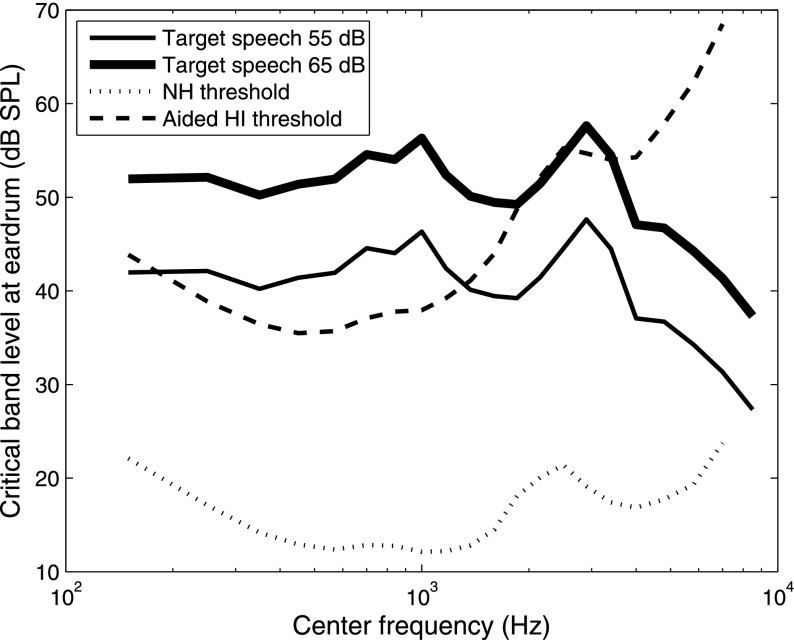
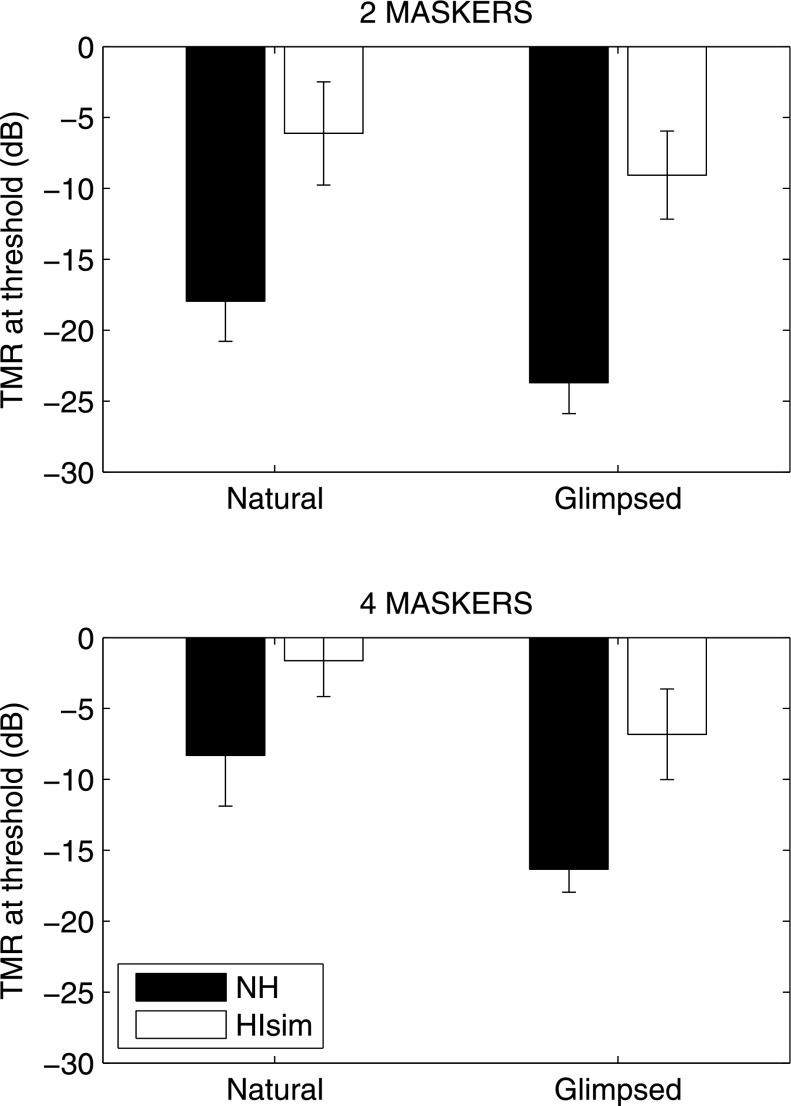
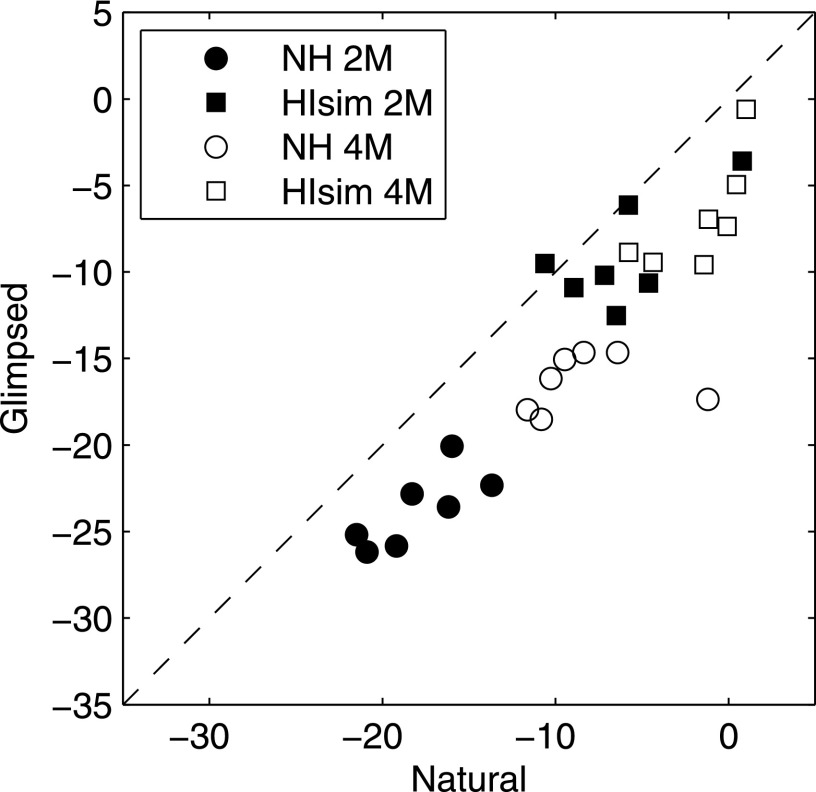
In many situations, listeners with sensorineural hearing loss demonstrate reduced spatial release from masking compared to listeners with normal hearing. This deficit is particularly evident in the "symmetric masker" paradigm in which competing talkers are located to either side of a central target talker. However, there is some evidence that reduced target audibility (rather than a spatial deficit per se) under conditions of spatial separation may contribute to the observed deficit. In this study a simple "glimpsing" model (applied separately to each ear) was used to isolate the target information that is potentially available in binaural speech mixtures. Intelligibility of these glimpsed stimuli was then measured directly. Differences between normally hearing and hearing-impaired listeners observed in the natural binaural condition persisted for the glimpsed condition, despite the fact that the task no longer required segregation or spatial processing. This result is consistent with the idea that the performance of listeners with hearing loss in the spatialized mixture was limited by their ability to identify the target speech based on sparse glimpses, possibly as a result of some of those glimpses being inaudible.


Figures

FIG. 1.
FIG. 1.
Individual audiograms for the eight hearing-impaired listeners who participated in the study (thin lines; averaged across left and right ears). Also shown is the across-subject mean for the seven listeners whose data were ultimately included in experiments 1 and 2 (thick lines and circles), and the across-subject mean for the six listeners on which the filtering for experiment 3 was based (thick lines and squares).
FIG. 2.
FIG. 2.
Top row: Proportion of time-frequency tiles (left) and energy (right) retained in one ear after application of the glimpsing model, as a function of TMR and number of maskers. Bottom row: Proportion of tiles (left) and energy (right) retained that were also retained in the other ear. Error bars indicate standard deviations across 100 simulated trials.
FIG. 3.
FIG. 3.
Left and right ear masks for an example target (the sentence “Sue gave three small gloves”) in the presence of two or four maskers at a TMR of −5 dB. The gray region indicates tiles that are in common across the ears, and the black regions indicate tiles that were retained in only one ear.
FIG. 4.
FIG. 4.
Mean thresholds (and across-subject standard deviations) for the different conditions in experiment 1.
FIG. 5.
FIG. 5.
Scatterplot showing individual thresholds for the glimpsed condition against individual thresholds for the natural condition in experiment 1.
FIG. 6.
FIG. 6.
Mean thresholds (and across-subject standard deviations) for the different conditions in experiment 2.
FIG. 7.
FIG. 7.
Scatterplot showing individual thresholds for the glimpsed condition against individual thresholds for the natural condition in experiment 2.
FIG. 8.
FIG. 8.
Critical band levels of unprocessed target speech at 55 and 65 dB SPL (thin/thick solid lines) estimated at the eardrum, shown in comparison to average NH hearing thresholds (dotted line) and average aided HI thresholds (dashed lines).
FIG. 9.
FIG. 9.
Mean thresholds (and across-subject standard deviations) for the different conditions in experiment 3.
FIG. 10.
FIG. 10.
Scatterplot showing individual thresholds for the glimpsed condition against individual thresholds for the natural condition in experiment 3.

References

    1. Ahlstrom, J. B. , Horwitz, A. R. , and Dubno, J. R. (2009). “ Spatial benefit of bilateral hearing AIDS,” Ear. Hear. 30, 203–218.10.1097/AUD.0b013e31819769c1 - DOI - PMC - PubMed
    1. ANSI (1997). ANSI S3.5-1997, Methods for Calculation of the Speech Intelligibility Index ( American National Standards Institute, New York: ).
    1. Baskent, D. , Eiler, C. L. , and Edwards, B. (2010). “ Phonemic restoration by hearing-impaired listeners with mild to moderate sensorineural hearing loss,” Hear. Res. 260, 54–62.10.1016/j.heares.2009.11.007 - DOI - PubMed
    1. Bernstein, J. G. , Mehraei, G. , Shamma, S. , Gallun, F. J. , Theodoroff, S. M. , and Leek, M. R. (2013). “ Spectrotemporal modulation sensitivity as a predictor of speech intelligibility for hearing-impaired listeners,” J. Am. Acad. Audiol. 24, 293–306.10.3766/jaaa.24.4.5 - DOI - PMC - PubMed
    1. Besser, J. , Festen, J. M. , Goverts, S. T. , Kramer, S. E. , and Pichora-Fuller, M. K. (2015). “ Speech-in-speech listening on the LiSN-S test by older adults with good audiograms depends on cognition and hearing acuity at high frequencies,” Ear Hear. 36, 24–41.10.1097/AUD.0000000000000096 - DOI - PubMed

Publication types

MeSH terms

LinkOut - more resources