

A predictive assessment of genetic correlations between traits in chickens using markers
- PMID: 28148241
- PMCID: PMC5286905
- DOI: 10.1186/s12711-017-0290-9
A predictive assessment of genetic correlations between traits in chickens using markers
Abstract
Background: Genomic selection has been successfully implemented in plant and animal breeding programs to shorten generation intervals and accelerate genetic progress per unit of time. In practice, genomic selection can be used to improve several correlated traits simultaneously via multiple-trait prediction, which exploits correlations between traits. However, few studies have explored multiple-trait genomic selection. Our aim was to infer genetic correlations between three traits measured in broiler chickens by exploring kinship matrices based on a linear combination of measures of pedigree and marker-based relatedness. A predictive assessment was used to gauge genetic correlations.
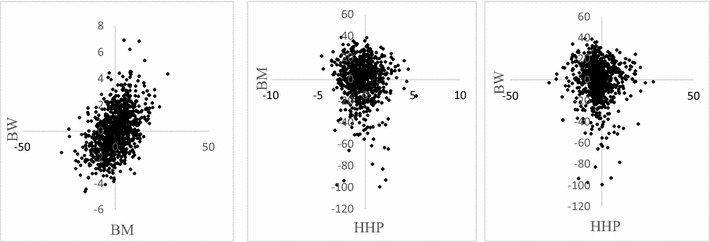
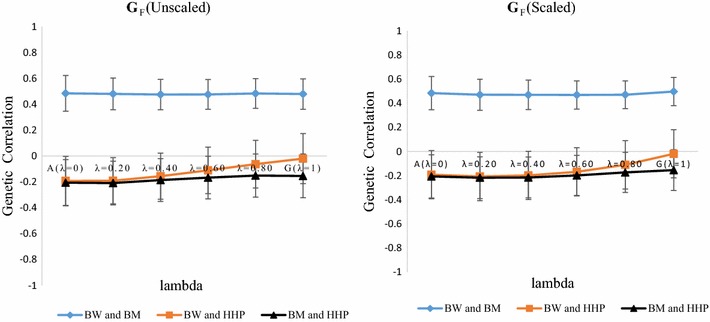
Methods: A multivariate genomic best linear unbiased prediction model was designed to combine information from pedigree and genome-wide markers in order to assess genetic correlations between three complex traits in chickens, i.e. body weight at 35 days of age (BW), ultrasound area of breast meat (BM) and hen-house egg production (HHP). A dataset with 1351 birds that were genotyped with the 600 K Affymetrix platform was used. A kinship kernel (K) was constructed as K = λ G + (1 - λ)A, where A is the numerator relationship matrix, measuring pedigree-based relatedness, and G is a genomic relationship matrix. The weight (λ) assigned to each source of information varied over the grid λ = (0, 0.2, 0.4, 0.6, 0.8, 1). Maximum likelihood estimates of heritability and genetic correlations were obtained at each λ, and the "optimum" λ was determined using cross-validation.
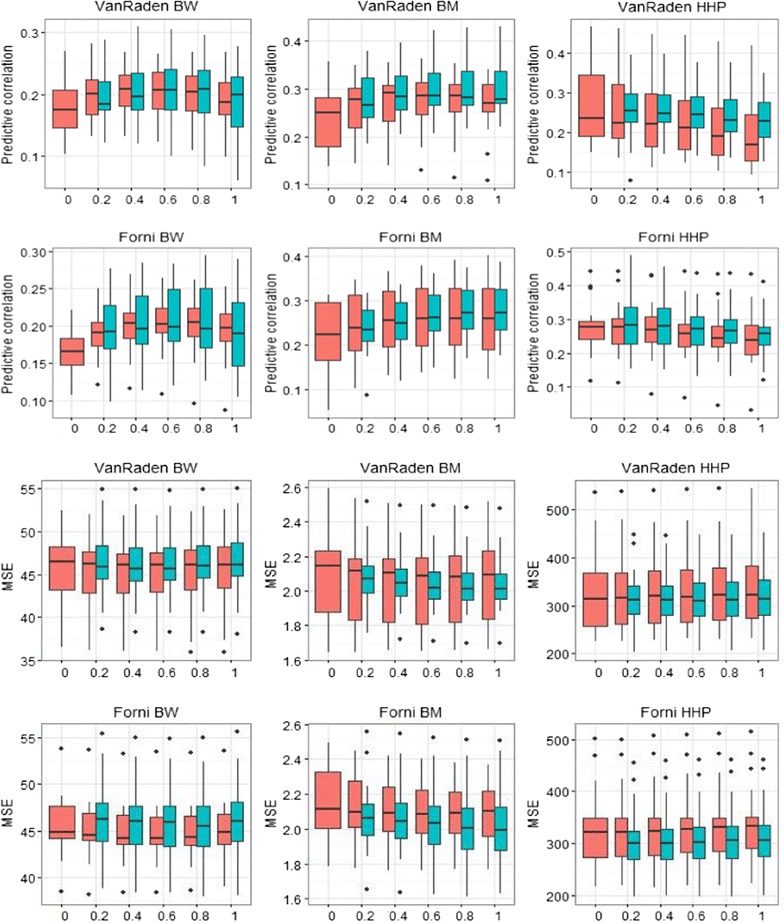
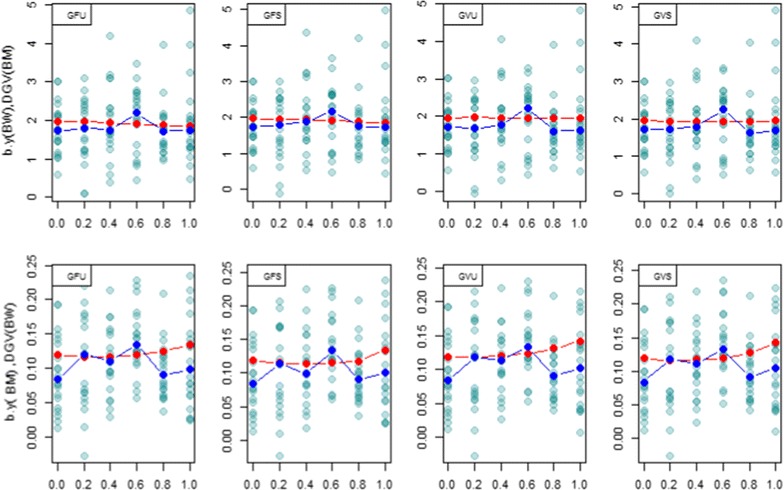
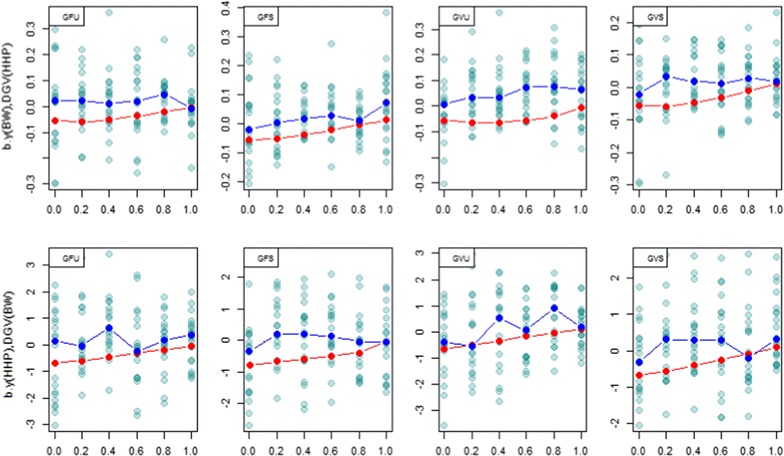
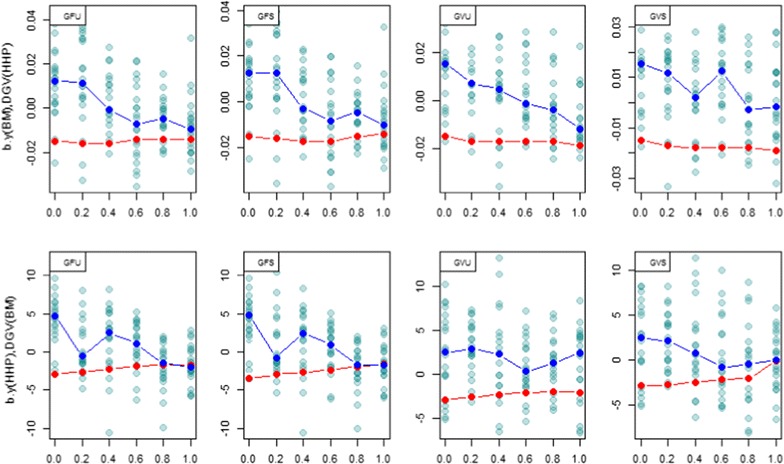
Results: Estimates of genetic correlations were affected by the weight placed on the source of information used to build K. For example, the genetic correlation between BW-HHP and BM-HHP changed markedly when λ varied from 0 (only A used for measuring relatedness) to 1 (only genomic information used). As λ increased, predictive correlations (correlation between observed phenotypes and predicted breeding values) increased and mean-squared predictive error decreased. However, the improvement in predictive ability was not monotonic, with an optimum found at some 0 < λ < 1, i.e., when both sources of information were used together.
Conclusions: Our findings indicate that multiple-trait prediction may benefit from combining pedigree and marker information. Also, it appeared that expected correlated responses to selection computed from standard theory may differ from realized responses. The predictive assessment provided a metric for performance evaluation as well as a means for expressing uncertainty of outcomes of multiple-trait selection.
Figures

Similar articles
-
Performance of pedigree and various forms of marker-derived relationship coefficients in genomic prediction and their correlations.J Anim Breed Genet. 2020 Sep;137(5):423-437. doi: 10.1111/jbg.12467. Epub 2020 Jan 30. J Anim Breed Genet. 2020. PMID: 32003127
-
Effect of allele frequencies, effect sizes and number of markers on prediction of quantitative traits in chickens.J Anim Breed Genet. 2014 Apr;131(2):123-33. doi: 10.1111/jbg.12075. Epub 2014 Jan 8. J Anim Breed Genet. 2014. PMID: 24397350
-
Differential contribution of genomic regions to marked genetic variation and prediction of quantitative traits in broiler chickens.Genet Sel Evol. 2016 Feb 3;48:10. doi: 10.1186/s12711-016-0187-z. Genet Sel Evol. 2016. PMID: 26842494 Free PMC article.
-
Prediction of malting quality traits in barley based on genome-wide marker data to assess the potential of genomic selection.Theor Appl Genet. 2016 Feb;129(2):203-13. doi: 10.1007/s00122-015-2639-1. Epub 2015 Dec 9. Theor Appl Genet. 2016. PMID: 26649866 Review.
-
Genetic evaluation of dairy cattle using a simple heritable genetic ground.J Sci Food Agric. 2010 Aug 30;90(11):1765-73. doi: 10.1002/jsfa.4041. J Sci Food Agric. 2010. PMID: 20564310 Review.
Cited by
-
Utilizing trait networks and structural equation models as tools to interpret multi-trait genome-wide association studies.Plant Methods. 2019 Sep 18;15:107. doi: 10.1186/s13007-019-0493-x. eCollection 2019. Plant Methods. 2019. PMID: 31548847 Free PMC article.
-
Genomic Relatedness Strengthens Genetic Connectedness Across Management Units.G3 (Bethesda). 2017 Oct 5;7(10):3543-3556. doi: 10.1534/g3.117.300151. G3 (Bethesda). 2017. PMID: 28860185 Free PMC article.
-
Genome-wide detection of CNVs and their association with performance traits in broilers.BMC Genomics. 2021 May 17;22(1):354. doi: 10.1186/s12864-021-07676-1. BMC Genomics. 2021. PMID: 34001004 Free PMC article.
-
Benefits of testing in both bio-secure and production environments in genomic selection breeding programs for commercial broiler chicken.Genet Sel Evol. 2018 Nov 3;50(1):52. doi: 10.1186/s12711-018-0430-x. Genet Sel Evol. 2018. PMID: 30390619 Free PMC article.
-
Weighting genomic and genealogical information for genetic parameter estimation and breeding value prediction in tropical beef cattle.J Anim Sci. 2018 Mar 6;96(2):612-617. doi: 10.1093/jas/skx027. J Anim Sci. 2018. PMID: 29385460 Free PMC article.
References
MeSH terms
Substances
LinkOut - more resources
Full Text Sources
Other Literature Sources
Research Materials
