. 2017 Feb 1;16(1):30.
doi: 10.1186/s12943-017-0594-y.

Dclk1, a tumor stem cell marker, regulates pro-survival signaling and self-renewal of intestinal tumor cells

Affiliations

Dclk1, a tumor stem cell marker, regulates pro-survival signaling and self-renewal of intestinal tumor cells

Parthasarathy Chandrakesan et al. Mol Cancer. .

Retraction in

Abstract

Background: More than 80% of intestinal neoplasia is associated with the adenomatous polyposis coli (APC) mutation. Doublecortin-like kinase 1 (Dclk1), a kinase protein, is overexpressed in colorectal cancer and specifically marks tumor stem cells (TSCs) that self-renew and increased the tumor progeny in Apc Min/+ mice. However, the role of Dclk1 expression and its contribution to regulating pro-survival signaling for tumor progression in Apc mutant cancer is poorly understood.

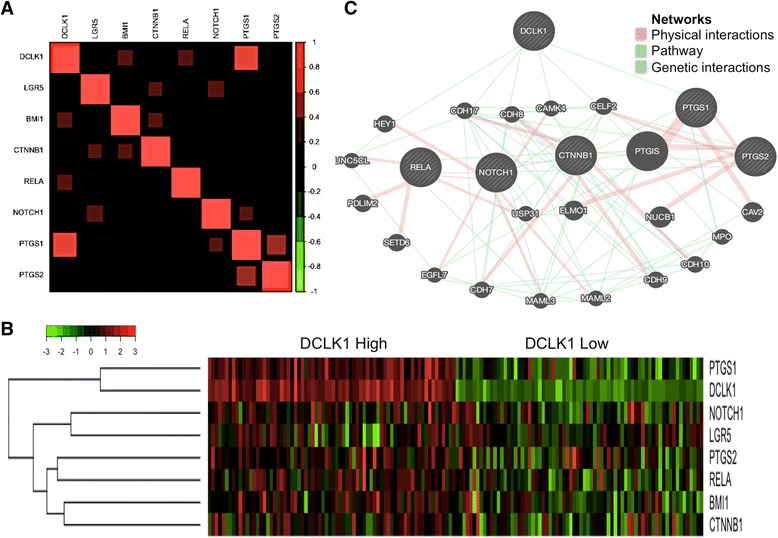
Methods: We analyzed DCLK1 and pro-survival signaling gene expression datasets of 329 specimens from TCGA Colon Adenocarcinoma Cancer Data. The network of DCLK1 and pro-survival signaling was analyzed utilizing the GeneMANIA database. We examined the expression levels of Dclk1 and other stem cell-associated markers, pro-survival signaling pathways, cell self-renewal in the isolated intestinal epithelial cells of Apc Min/+ mice with high-grade dysplasia and adenocarcinoma. To determine the functional role of Dclk1 for tumor progression, we knocked down Dclk1 and determined the pro-survival signaling pathways and stemness. We used siRNA technology to gene silence pro-survival signaling in colon cancer cells in vitro. We utilized FACS, IHC, western blot, RT-PCR, and clonogenic (self-renewal) assays.

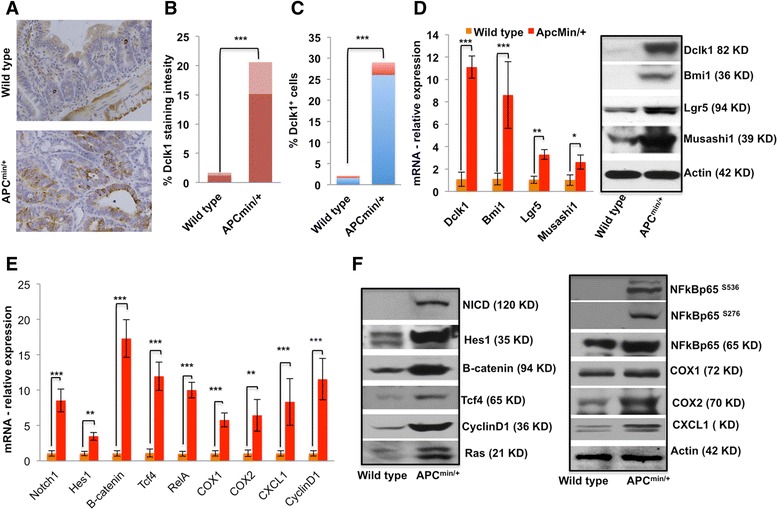
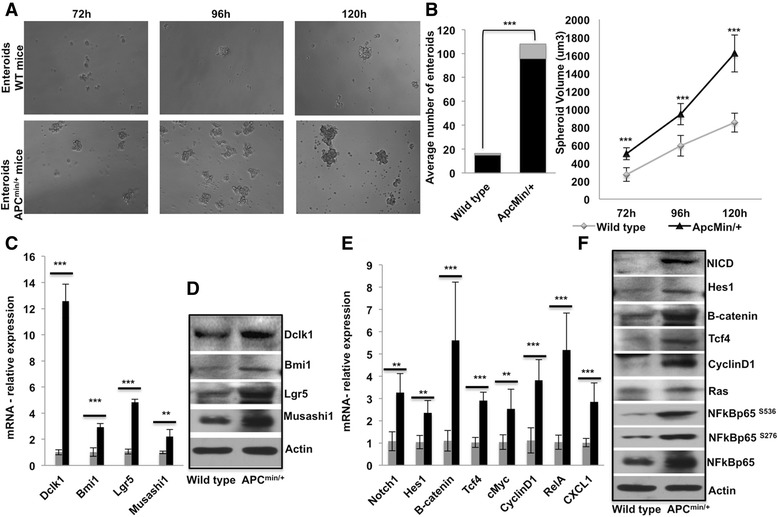
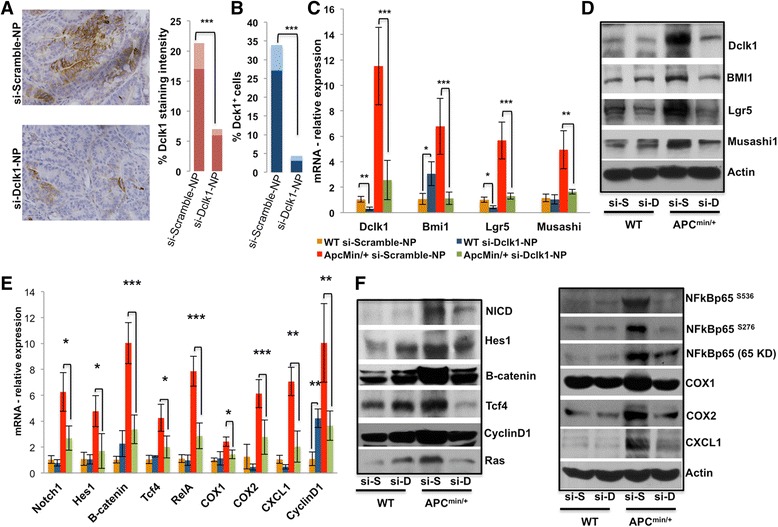
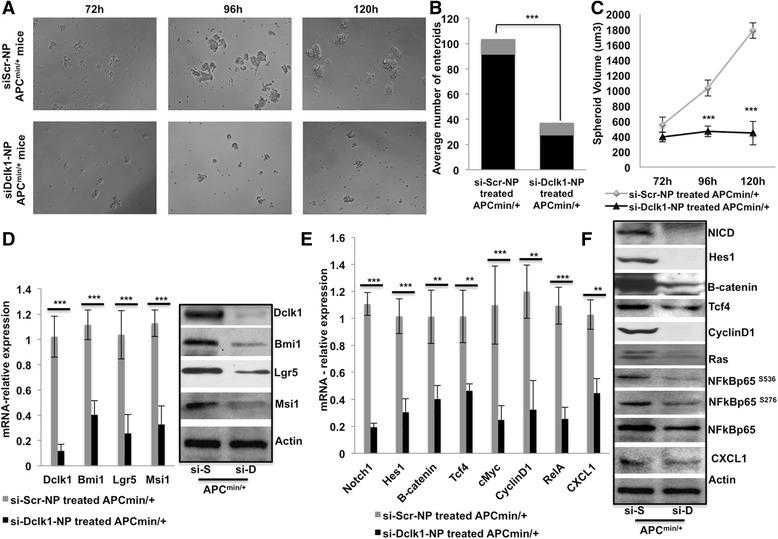
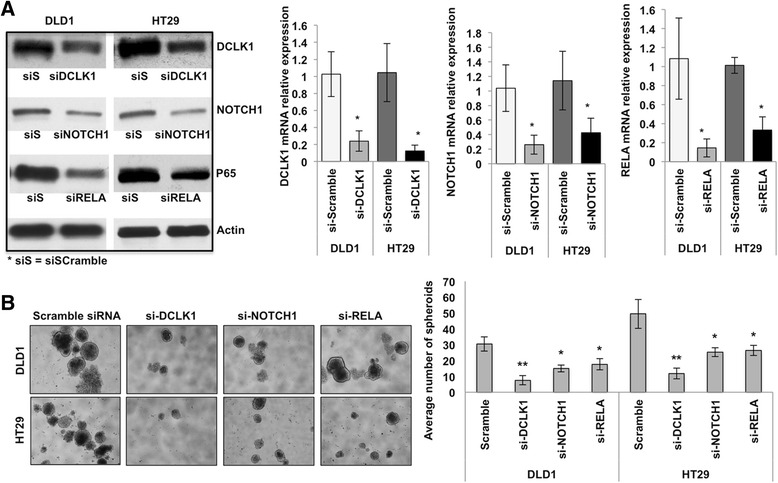
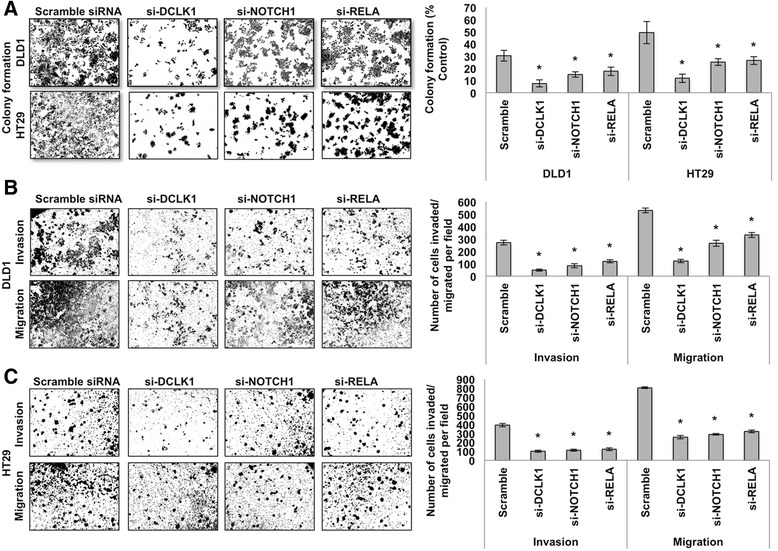
Results: We found a correlation between DCLK1 and pro-survival signaling expression. The expression of Dclk1 and stem cell-associated markers Lgr5, Bmi1, and Musashi1 were significantly higher in the intestinal epithelial cells of Apc Min/+ mice than in wild-type controls. Intestinal epithelial cells of Apc Min/+ mice showed increased expression of pro-survival signaling, pluripotency and self-renewal ability. Furthermore, the enteroids formed from the intestinal Dclk1+ cells of Apc Min/+ mice display higher pluripotency and pro-survival signaling. Dclk1 knockdown in Apc Min/+ mice attenuates intestinal adenomas and adenocarcinoma, and decreases pro-survival signaling and self-renewal. Knocking down RELA and NOTCH1 pro-survival signaling and DCLK1 in HT29 and DLD1 colon cancer cells in vitro reduced the tumor cells' ability to self-renew and survive.

Conclusion: Our results indicate that Dclk1 is essential in advancing intestinal tumorigenesis. Knocking down Dclk1 decreases tumor stemness and progression and is thus predicted to regulate pro-survival signaling and tumor cell pluripotency. This study provides a strong rationale to target Dclk1 as a treatment strategy for colorectal cancer.

Keywords: APC mutation; Cancer stem cells; Colorectal cancer; Dclk1; Intestinal epithelial cells; Nanoparticles; Pro-survival signaling; Self-renewal.


Figures

Fig. 1
Fig. 1
DCLK1 expression is positively correlated with genes of pro-survival signaling pathways and tumor stem cell markers. a Color indicates correlation of DCLK1 and other genes: 1) negative (green), and 2) positive (red). b Heatmap of pro-survival signaling pathways and tumor stem cell markers gene expression levels by dividing colon cancer patients into two groups based on DCLK1 expression levels from TCGA. Patients with the top 25% or bottom 25% DCLK1 expression levels were considered DCLK1-high or DCLK1-low, respectively. c A gene network from GeneMANIA shows the relationships for genes from the list (nodes) connected (with edges) according to the functional association networks from the databases. Based on the physical interactions, pathway, and genetic interactions, in the network representation, all the nodes are connected and related to DCLK1
Fig. 2
Fig. 2
Increased expression of Dclk1 and Dclk1+ cells in the intestinal adenomas and adenocarcinomas of Apc Min/+ mice is associated with enhanced expression of tumor stem cell markers and pro-survival signaling. a IHC for Dclk1 in the small intestines of WT and Apc Min/+ mice. b Staining intensity was scored and is represented as a bar graph. c FACS data representing the % Dclk1+ cells isolated from the small intestines of WT and Apc Min/+ mice. d Differences in the number of Dclk1+ cells in staining and FACS corroborate with protein and mRNA levels of Dclk1 in the isolated IECs of WT and Apc Min/+ mice; protein and mRNA levels analyzed by western blot and RT-PCR of Bmi1, Lgr5, and Musashi1 in isolated IECs from WT and Apc Min/+ mice. f Protein expression levels of pro-survival signaling and their downstream targets in the isolated IECs of WT and Apc Min/+ mice, analyzed by western blot. e mRNA expression levels of pro-survival signaling and their downstream targets in the isolated IECs of WT and Apc Min/+ mice, analyzed by RT-PCR. All quantitative data are expressed as means ± SD of a minimum of three independent experiments. P values of <0.05 = *, <0.01 = **, and 0.001 = *** were considered statistically significant
Fig. 3
Fig. 3
Dclk1+ cells isolated from the IECs of Apc Min/+ mice display enhanced self-renewal ability and enriched tumor stem cell markers and pro-survival signaling. a Enteroids formation of isolated Dclk1+ cells (100 cell per well) from the small intestines of WT and Apc Min/+ mice. b Stacked bar and line graph represent the quantification of the number of enteroids formed and spheroid volume from the Dclk1+ cells isolated from WT and Apc Min/+ mice. c & d mRNA and protein expression of Dclk1, Bmi1, Lgr5, and Msi1 in the isolated IECs of Apc Min/+ mice compared with WT mice. e & f mRNA and protein expression of pro-survival signaling and their downstream targets in the isolated IECs of Apc Min/+ mice compared with WT mice. All quantitative data are expressed as means ± SD of a minimum of three independent experiments. P values of <0.05 = *, <0.01 = **, and 0.001 = *** were considered statistically significant
Fig. 4
Fig. 4
Dclk1 knockdown reduced the expression of Dclk1 and Dclk1+ cells and the associated expression of tumor stem cell markers and pro-survival signaling in the Apc Min/+ mice. a IHC for Dclk1 in the small intestines of Apc Min/+ mice treated with siDclk1-NPs and siScramble-NPs; staining intensity was scored and represented as a bar graph. b FACS data representing the % Dclk1+ cells isolated from the small intestines of Apc Min/+ mice treated with siDclk1-NPs compared with siScramble-NPs. c & d mRNA and protein expression levels of Dclk1, Bmi1, Lgr5, and Musashi1 in the isolated IECs of WT and Apc Min/+ mice treated with siDclk1-NPs and siScramble-NPs, analyzed by RT-PCR and western blot. f Protein expression levels of pro-survival signaling and their downstream targets in the isolated IECs of WT and Apc Min/+ mice, analyzed by western blot. e mRNA expression levels of pro-survival signaling and their downstream targets in the isolated IECs of WT and Apc Min/+ mice, analyzed by RT-PCR. All quantitative data are expressed as means ± SD of a minimum of three independent experiments. P values of <0.05 = *, <0.01 = **, and 0.001 = *** were considered statistically significant
Fig. 5
Fig. 5
Dclk1 knockdown in the Apc min/+ mice reduced the stemness and pro-survival signaling of Dclk1+ cells. a Enteroids formation of isolated Dclk1+ cells (100 cell per well) from the small intestines of Apc Min/+ mice treated with siDclk1-NPs and siScramble-NPs. b Stacked bar and c line graph represent the quantification of the number of enteroids formed and spheroid volume from the isolated Dclk1+ cells of Apc Min/+ mice. d mRNA and protein expression of Dclk1, Bmi1, Lgr5, and Msi1 in the isolated IECs of Apc Min/+ mice treated with siDclk1-NPs and siScramble-NPs. e & f mRNA and protein expression of pro-survival signaling and their downstream targets in the isolated IECs of Apc Min/+ mice treated with siDclk1-NPs and siScramble-NPs. All quantitative data are expressed as means ± SD of a minimum of three independent experiments. P values of <0.05 = *, <0.01 = **, and 0.001 = *** were considered statistically significant
Fig. 6
Fig. 6
Silencing DCLK1 and pro-survival signaling NOTCH1 and RELA reduce the self-renewal ability of human colon cancer cells (DLD1 & HT29). a Protein and mRNA expression levels of DCLK1, NOTCH1, and RELA in the DLD1 and HT29 colon cancer cells transfected with si-DCLK1, si-NOTCH1, and siRELA compared with siScramble-transfected cells. b Self-renewal ability of DLD1 and HT29 cells after the knockdown of DCLK1, NOTCH1, and RELA; bar graph represents the average number of spheroids formed from DLD1 and HT29 cells after the knockdown of DCLK1, NOTCH1, and RELA. All quantitative data are expressed as means ± SD of a minimum of three independent experiments. P values of <0.05 were considered statistically significant
Fig. 7
Fig. 7
Silencing DCLK1 and pro-survival signaling reduced the survival ability of human DLD1 & HT29 colon cancer cells. a Colony formation ability of DLD1 and HT29 cells after the knockdown of DCLK1, NOTCH1, and RELA; bar graph represents the average number of colonies formed from DLD1 and HT29 cells after the knockdown of DCLK1, NOTCH1, and RELA. b In vitro invasion and migration of DLD1 cells after the knockdown of DCLK1, NOTCH1, and RELA; bar graph represents the number of cells migrated and invaded after the knockdown of DCLK1, NOTCH1, and RELA. c In vitro invasion and migration of HT29 cells after the knockdown of DCLK1, NOTCH1, and RELA, bar graph represents the number of cells migrated and invaded after the knockdown of DCLK1, NOTCH1, and RELA. All quantitative data are expressed as means ± SD of a minimum of three independent experiments. P values of <0.05 were considered statistically significant

References

    1. Fearnhead NS, Britton MP, Bodmer WF. The ABC of APC. Hum Mol Genet. 2001;10:721–733. doi: 10.1093/hmg/10.7.721. - DOI - PubMed
    1. Rustgi AK. The genetics of hereditary colon cancer. Genes Dev. 2007;21:2525–2538. doi: 10.1101/gad.1593107. - DOI - PubMed
    1. Lewis A, Segditsas S, Deheragoda M, Pollard P, Jeffery R, Nye E, Lockstone H, Davis H, Clark S, Stamp G, et al. Severe polyposis in Apc(1322 T) mice is associated with submaximal Wnt signalling and increased expression of the stem cell marker Lgr5. Gut. 2010;59:1680–1686. doi: 10.1136/gut.2009.193680. - DOI - PMC - PubMed
    1. Kinzler KW, Vogelstein B. Lessons from hereditary colorectal cancer. Cell. 1996;87:159–170. doi: 10.1016/S0092-8674(00)81333-1. - DOI - PubMed
    1. Wasan HS, Novelli M, Bee J, Bodmer WF. Dietary fat influences on polyp phenotype in multiple intestinal neoplasia mice. Proc Natl Acad Sci U S A. 1997;94:3308–3313. doi: 10.1073/pnas.94.7.3308. - DOI - PMC - PubMed

Publication types

MeSH terms

Substances

LinkOut - more resources